Download

1 / 33
330 likes | 462 Views
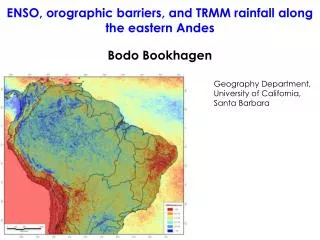
Recent Improvements to the TRMM Microwave Imager Land Rainfall Algorithm. Nai-Yu Wang, Kaushik Gopalan, and Ralph Ferraro Cooperative Institute of Climate Studies, University of Maryland. Motivation.

E N D
Recent Improvements to the TRMM Microwave Imager Land Rainfall Algorithm Nai-Yu Wang, Kaushik Gopalan, and Ralph Ferraro Cooperative Institute of Climate Studies, University of Maryland
Motivation • Continuing support of the TRMM Microwave Imager (TMI) land precipitation algorithm to the science community • Empirical approach chosen due to fast-approaching TRMM v7 deadline • TMI rain rate (RR) found to have regional and seasonal biases; Precipitation radar rain rates thought to be more physically realistic than TMI v6 RR • Can we make the TMI “more like” PR?
Overview • TMI brightness temperature (Tb)- PR rain rate (RR) regressions for different storm types using University of Utah PF database • Identifying convective storms using TMI Tb values • Comparison of regression fit RRs with current TMI v6
TMI – PR collocations : Example The avg. of the 3 PR RRs is used as the “true” RR for this TMI pixel TMI EFOV : 7.2 km x 4.6 km Along-track PR footprints : ~4.5 km at edge of scan
Separation of regression fits by storm type • Convective and Stratiform storms separated during training using PR rain type flag • Seasonal variations and differences between storms in the tropics and sub-tropics (proxy for surface types) were investigated
Convective/stratiform Rain (Jan 2002 – Dec 2008) Binned RR Avgs for 10K Tb bins with >5000 points per Tb bin RR saturates at 18 mm/hr Error bars depict +/- 0.5 Std. Dev. for each Tb bin
Latitude and seasonal dependence • Analyzed using Sep 2002 - Aug 2008 data • Separation of high latitudes (>20) and low latitudes (<=20) • Clear differences in rain rate regressions for the different cases
Latitude and Seasonal separation (Convective) Saturates at ~20 mm; which is unrealistic
Latitude and Seasonal separation (Stratiform) Saturates at 1.5 mm/hr
Filtering the Training set • Filter out pixels where there is surface scattering/water contamination • Pixels where TMI RR >= 1.5 PR RR are excluded from the convective regressions • Filter out pixels with warm rain where there is no corresponding depression in the 85V Tb • Pixels where TMI RR <= 0.5 PR RR are excluded from the stratiform regressions
Final regressions Cubic fit Linear fit
Convective/Stratiform separation • The TMI rain-rate is a weighted sum of convective/stratiform portion * convective/stratiform rain-rate • RR = RR_conv*P(Conv) + RR_strat*(1-P(Conv)) • P(Conv) is the estimated probability of the current pixel observing a convective storm • Weighted averages of 10, 19, 37 GHz V-Pol TBs, 85 GHz polarization difference, and std of 85V 7X3 pixels
P(Conv) v6 v7
Mean conditional monthly biases (Jan 2002 – Dec 2008) Avg. global bias for TMI – PR rain collocations
Mean unconditional monthly biases (Jan 2002 – Dec 2008) Includes non-raining pixels. Effect of screening errors is seen here.
Unconditional global rainfall meanJan 2002 – Dec 2008 ~66 % reduction in global TMI – PR RR bias
Conclusions • Overall bias between TMI and PR is reduced by >50% • This algorithm is delivered to CSU for extensive testing; The rain-rate product is scheduled to be released in late 2010 by the TRMM project office. • Some persistent problems remain, they are mainly associated with rain detection and surface screening, e.g., seasonal variation in Rain/ No rain screening , false alarms over arid land and missed warm rain. Researchers at CICS are currently working on a new methodology of using surface- type climatology maps (both static and dynamic), to replace the traditional surface screening method.
Storm case : Orbit 34747 (over Argentina) RR saturates at ~52 mm/hr TMI v6 TMI Regression Max RR : ~85 mm/hr. Better contrast as compared to v6
PR RR Storm case : Orbit 34747 (over Argentina) Max RR : ~122 mm/hr
Storm case : Orbit 34747 (over Argentina) Low RR High RR RR distributions from TMI and PR for the convective storm
Zonal Averages TMI v6 TMI v7 Missed rain in DJF (northern winter) Missed rainfall due to screening errors in JJA (southern winter)