Download
1 / 36
370 likes | 537 Views
Introductory Workshop on Grid-based Map Analysis Techniques and Modeling. New York State Geographic Information Systems 23 rd Annual Conference — October 1 and 2, 2007 — Albany, New York. www.innovativegis.com/basis/present/NYGIS07/ …to download workshop materials. Presentation by

E N D
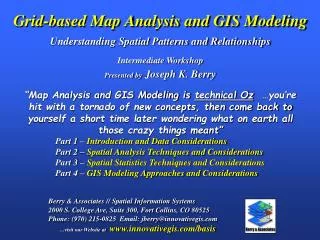
Introductory Workshop onGrid-based Map Analysis Techniques and Modeling New York State Geographic Information Systems 23rd Annual Conference — October 1 and 2, 2007 — Albany, New York www.innovativegis.com/basis/present/NYGIS07/ …to download workshop materials Presentation by Joseph K. Berry W.M. Keck Scholar in Geosciences, University of DenverPrincipal, Berry & Associates // Spatial Information Systems2000 S. College Ave, Suite 300, Fort Collins, CO 80525Phone: (970) 215-0825 Email: jberry@innovativegis.com Website at www.innovativegis.com/basis
Manual map drafting …8,000 years Computer Mapping automates the cartographic process (70s) Spatial Database Management links computer mapping techniques with traditional database capabilities (80s) GIS Analysis and Modeling representation of relationships within and among mapped data (90s) Historical Setting and GIS Evolution What do you think is the current (00s) frontier? …but that’s another story (See Beyond Mapping III, “Topic 27”, www.innovativegis.com/basis ) (Berry)
Click on… Info Tool Theme Table Distance Zoom Pan Select Theme Now for a Geo-Query… Spatial Table Query Builder : Object ID X,Y X,Y X,Y : …identify tall aspen stands Attribute Table FeatureSpeciesetc. : : Object ID Aw : : Big …over 400,000m2 (40ha)? Discrete, irregular map features (objects) Desktop Mapping Framework (Berry)
Click on… Shading Manager Zoom Pan Rotate Display Grid Analysis …calculate a slope map and drape on the elevation surface Grid Table : --, --, --, --, --, --, --, --, --, --, --, --, --, 1667.0, --, --, --, --, --, : Continuous, regular set of grid cells (objects) Points, Lines, Polygons and Surfaces MAP Analysis Framework(Raster/Grid) (See Beyond Mapping III, “Topic 18”,www.innovativegis.com/basis ) (Berry)
Calculating Slope and Flow(Map Analysis) Inclination of a fitted plane to a location and its eight surrounding elevation values Slope (47,64) = 33.23% Slope map draped on Elevation Slope map Flow (28,46) = 451 Paths Elevation Surface Total number of the steepest downhill paths flowing into each location Flow map draped on Elevation (Berry) Flow map
Deriving Erosion Potential Erosion Potential Erosion_potential Slopemap Slope_classes Flow/Slope Flowmap Flow_classes But reality suggests that all buffer-feet are not the same… Need to reach farther under some conditions and not as far under others— common sense? Simple Buffer (Berry)
Distance away from the streams is a function of the erosion potential (Flow/Slope Class) with intervening heavy flow and steep slopes computed as effectively closer than simple geographic distance— Effective Erosion Distance Erosion Buffers Close Far Simple Buffer Heavy/Steep (far from stream) Erosion_potential Effective Buffer Light/Gentle (close) (click for digital slide show VBuff) Streams Calculating Effective Distance(variable-width buffer) (See Beyond Mapping III, “Topics 11 & 13”, www.innovativegis.com/basis ) (Berry)
Traditional GIS Spatial Analysis Forest Inventory Map Erosion Potential (Surface) • Points, Lines, Polygons • Discrete Objects • Mapping and Geo-query • Cells, Surfaces • Continuous Geographic Space • Contextual Spatial Relationships Traditional Statistics Spatial Statistics Spatial Distribution (Surface) Minimum= 5.4 ppm Maximum= 103.0 ppm Mean= 22.4 ppm StDEV= 15.5 • Mean, StDev (Normal Curve) • Central Tendency • Typical Response (scalar) • Map of Variance (gradient) • Spatial Distribution • Numerical Spatial Relationships Mapped Data Analysis (SA and SS) (Berry) (See Beyond Mapping III, “Topic 24”, www.innovativegis.com/basis)
Evaluating Habitat Suitability • Assumptions – Hugags like… • gentle slopes • southerly aspects • low elevations Generating maps of animal habitat… Manual Map Overlay (Binary) Ranking Overlay (Binary Sum) Rating Overlay (Rating Average) (click for digital slide show Hugag) (Berry)
Conveying Suitability Model Logic gentle slopes Elevation Slope Slope Preference Bad 1 to 9 Good Reclassify (Times 1) southerly aspects Elevation Aspect Aspect Preference Bad 1 to 9 Good Habitat Rating Bad 1 to 9 Good (1) Hugag.scr Reclassify Overlay lower elevations Elevation Elevation Preference Bad 1 to 9 Good (1) Reclassify Habitat Rating 0= No, 1 to 9 Good Overlay Algorithm Calibrate Weight Base Maps Derived Maps Interpreted Maps Solution Map …while Reclassify and Overlay operations aren’t very exciting, they are frequently used Fact Judgment Covertype Water Mask 0= No, 1= Yes Reclassify Constraint Map (Berry) (See Beyond Mapping III, “Topics 22 & 23”, www.innovativegis.com/basis )
Extending Model Criteria (Times 10) (1) (1) forests Forests Forest Proximity Forest Preference Bad 1 to 9 Good (10) • Hugags are 10 times more concerned with slope, forest and water criteriathan aspect and elevation water Water Water Proximity Water Preference Bad 1 to 9 Good (10) gentle slopes Elevation Slope Slope Preference Bad 1 to 9 Good southerly aspects Elevation Aspect Aspect Preference Bad 1 to 9 Good Habitat Rating Bad 1 to 9 Good lower elevations Additional criteria can be added… Elevation Elevation Preference Bad 1 to 9 Good • Hugags would prefer to be in/near forested areas • Hugags would prefer to be near water (Berry)
Basic Advanced Classes of Spatial Analysis Operators (contextual) …all Spatial Analysis involves generating new map values (numbers) as a mathematical or statistical function of the values on another map layer(s) (Berry)
Establishing Distance and Connectivity (digital slide show DIST2) (See Beyond Mapping III, “Topic 25”, www.innovativegis.com/basis ) (See Beyond Mapping III, “Topic 15”, www.innovativegis.com/basis for related material on Visual Exposure Analysis) (Berry)
(digital slide show TTime) …subtracting two proximity surfaces identifies relative advantage Zero– equidistant Sign– which has the advantage Magnitude– advantage strength Accumulation Surface Analysis (customer travel-time) See Beyond Mapping III, “Topics 5, 14 and 17”, www.innovativegis.com/basis for more information (Berry)
Existing Powerline Goal– identify thebest route for an electric transmission linethat considers various criteria for minimizing adverse impacts. Proposed Substation Houses • Criteria – the transmission line route should… • Avoid areas ofhigh housing density • Avoid areas that arefar from roads • Avoid areaswithin or near sensitive areas • Avoid areas of highvisual exposure to houses Roads Sensitive Areas Elevation Houses Transmission Line Siting Model (Berry)
Avoid areas of… High Housing Density Far from Roads In or Near Sensitive Areas High Visual Exposure …build on this single factor Model logic is captured in a flowchart where the boxes represent maps and lines identify processing steps leading to a spatial solution Siting Model Flowchart (Model Logic) (Berry)
Step 1 Identify overall Discrete Preference(1 good to 9 bad rating) End Start Start Step 2 Generate anAccumulated Preferencesurface from the starting location to everywhere End Step 3 Step 2 Step 1 Step 3 Identify theMost Preferred Routefrom the end location Model logic is captured in a flowchart where the boxes represent maps and lines identify processing steps leading to a spatial solution Siting Model Flowchart (Model Logic) (See Beyond Mapping III, “Topic 19”, www.innovativegis.com/basis ) (Berry)
Step 1 Discrete Preference Map Calibration Weighting HDensity RProximity SAreas VExposure (Berry)
Step 2 Accumulated Preference Map Animated slide set AccumSurface2.ppt Splash Algorithm – like tossing a stick into a pond with waves emanating out and accumulating costs as the wave front moves (Berry)
Step 3 Most Preferred Route …steepest downhill path “re-traces” the accumulated cost wave front that got there first (Berry)
Generating Optimal Path Corridors Animated slide set Total_accumulation_flood.ppt (Berry)
…see Application Paper \GW04_routingon the Workshop CD Infusing stakeholder perspectives into Calibration and Weighting …of Engineering considerations, Natural Environment consequences and Built Environment impacts Global routing solution identifies the Optimal Route (blue line) and Optimal Corridor (cross-hatched) …see Application Paper \GITA_Oil&Gas_04on the Workshop CD Power and Pipeline Routing (Advanced GIS Models) (Berry)
Increased population growth into the wildland/urban interface raises the threat of disaster… …an extensive GIS model was developed to identify areas most likely to be impacted by wildfire so effective pre-treatment, suppression and recovery plans can be developed Modeling Wildfire Risk (…see Application Paper \GW05_Wildfireon the Workshop CD) (Berry)
Traditional GIS Spatial Analysis Forest Inventory Map Erosion Potential (Surface) • Points, Lines, Polygons • Discrete Objects • Mapping and Geo-query • Cells, Surfaces • Continuous Geographic Space • Contextual Spatial Relationships Traditional Statistics Spatial Statistics Spatial Distribution (Surface) Minimum= 5.4 ppm Maximum= 103.0 ppm Mean= 22.4 ppm StDEV= 15.5 • Mean, StDev (Normal Curve) • Central Tendency • Typical Response (scalar) • Map of Variance (gradient) • Spatial Distribution • Numerical Spatial Relationships Mapped Data Analysis (SA and SS)
…just like there are fundamental Spatial Analysis classes of operations, there are Fundamental Spatial Statistics classes of operations— • Descriptive Statistics • Within a Map – Min, Max, Mode; Count, Perimeter Area; • Mean, StdDeviation; Median, QRange, … • Among Maps – Coincidence, Overlap, Correlation, … • Surface Modeling(discrete point samples to continuous map surface) • Density Analysis – count of number of points within a roving window • Spatial Interpolation – weighted average of values within window (e.g. IDW and Krig) • Map Generalization – fit of an equation to all values (e.g. plane and polynomial) • Spatial Data Mining(numerical relationships within and among maps) • Map Similarity and Clustering – uses multivariate “data distance” for similarity • Prediction Models – uses Regression and Knowledge Engines to relate dependent • and independent map variables Classes of Spatial Statistics Operators (numerical) (Berry)
Digital maps are linked to descriptive data by attribute tables (vector) or directly to data matrices (grid) Red is unusually high (Mean + 1 StDev) Red is unusually high (Median + 1 QRange) …inconsistent results because the data is not normally distributed— Infeasible Map data can be generalized into a single statistic (e.g. Mean or Median) …throwing the baby (spatial distribution) out with the bath water (data) …most desktop mapping applications simply “paint” a color corresponding to the average regardless of numerical or spatial patterns of the field collected data within a parcel Statistical Nature of Mapped Data(descriptive) (See Beyond Mapping III, “Topic 7”, www.innovativegis.com/basis ) (Berry)
Point Density analysis identifies the number of customers within a specified distance of each grid location Roving Window (count) Point Density Analysis (Berry)
Pockets of unusually high customer density are identified as more than one standard deviation above the mean Unusually high customer density (>1 Stdev) Identifying Unusually High Density (Berry)
Spatial Interpolation(Smoothing the Variability) The “iterative smoothing” process is similar to slapping a big chunk of modeler’s clay over the “data spikes,” then taking a knife and cutting away the excess to leave a continuous surface that encapsulates the peaks and valleys implied in the original field samples (click for digital slide show SStat2) …repeated smoothing slowly “erodes” the data surface to a flat plane= AVERAGE (See Beyond Mapping III, “Topic 2” and “Topic 8”, www.innovativegis.com/basis ) (Berry)
Phosphorous (P) What spatial relationships do you see? …do relatively high levels of P often occur with high levels of K and N? …how often? …where? Visualizing Spatial Relationships Interpolated Spatial Distribution (See Beyond Mapping III, “Topic 16”, www.innovativegis.com/basis ) (Berry)
Map surfaces are clustered to identify data pattern groups Relatively low responses in P, K and N Relatively high responses in P, K and N Geographic Space …groups of “floating balls” in data space of locations in the field identify similar data patterns– data zones …apply different management actions for different “data zones” Clustered Data Zones Variable Rate Application Data Space Clustering Maps for Data Zones Geographic Space (See Beyond Mapping III, “Topic 10”, www.innovativegis.com/basis ) (Berry)
The Precision Ag Process(Fertility example) Steps 1) – 3) On-the-Fly Yield Map Map Analysis Step 4) Cyber-Farmer, Circa 1992 Farm dB Prescription Map Variable Rate Application Step 5) Step 6) As a combine moves through a field it 1) uses GPS to check its location then 2) checks the yield at that location to 3) create a continuous map of the yield variation every few feet. This map is 4) combined with soil, terrain and other maps to derive 5) a “Prescription Map” that is used to 6) adjust fertilization levels every few feet in the field (variable rate application). (Berry) …see Application Paper \GW98_PrecisionAgon the Workshop CD
Mapped data that exhibits high spatial dependency create strong prediction functions. As in traditional statistical analysis, spatial relationships can be used to predict outcomes …the difference is that spatial statistics predicts where responses will be high or low Spatial Data Mining Precision Farming is just one example of applying spatial statistics and data mining techniques (Berry)
…Geo-Business applications are might be the biggest potential arena for Geotechnology that is one of the three mega-trends for the 21st century (Biotechnology, Nanotechnology) GeoExploration vs. GeoScience …see Application Paper \GW06_retailon the Workshop CD Retail Competition Analysis (Berry)
Where Have We Been? Grid-based Map Analysis is more different than it is similar to Traditional Mapping— • Mapping (70s), Modeling (80s) and Modeling (90s) • Vector (discrete objects) vs. Raster/Grid (continuous surfaces) • Spatial Analysis — analytical tools for investigating CONTEXTUAL relationships within and among map layers • Reclassifying Maps, Overlaying Maps, Measuring Distance and Connectivity, Summarizing Neighbors • GIS Modeling involves sequencing map analysis operations to solve spatial problems (map-ematics) • Spatial Statistics — analytical tools for investigating NUMERICAL relationships within and among map layers • Descriptive Statistics (aggregate summaries) • Surface Modeling (discrete point data to a continuous spatial distribution) • Spatial Data Mining (identifying relationships within and among map layers) Counter-intuitive? A bit deep?
ONLINE REFERENCE — see the online book Beyond Mapping III(Berry, BASIS Press) that is posted at…www.innovativegis.com/basis ... application papers referenced in this presentation are included on the Workshop CD WORKSHOP CD — contains the PowerPoint slide set, notes, background reading, hands-on tutorial using MapCalc Learner software (14-day evaluation) NEW BOOK — seethe description of the Map Analysisbook (Berry, 2007; GeoTec Media)at…www.innovativegis.com/basis …develops a structured view of the important concepts, considerations and procedures involved in grid-based map analysis. …the companion CD contains further readings and software for hands-on experience with the material presented. What’s Next? (References and Homework) Joseph K. Berry, jberry@innovativegis.com