Download
1 / 19
190 likes | 196 Views
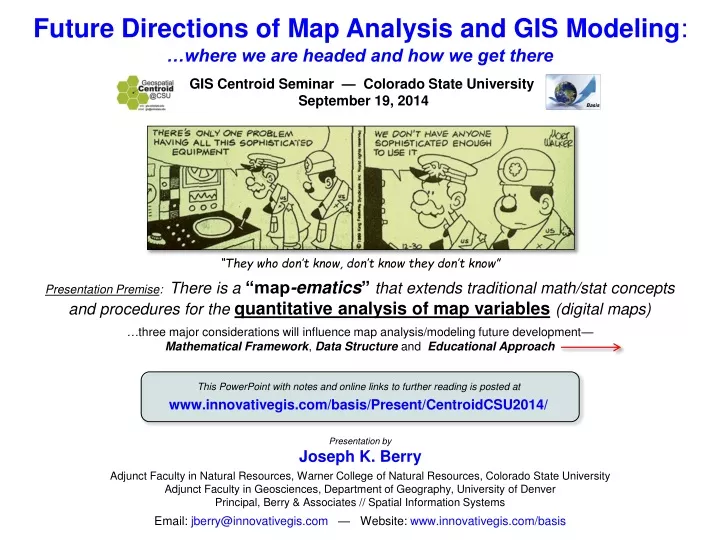
Future Directions of Map Analysis and GIS Modeling :. …where we are headed and how we get there. GIS Centroid Seminar — Colorado State University September 19, 2014. Basis. “They who don’t know, don’t know they don’t know”.

E N D
Future Directions of Map Analysis and GIS Modeling: …where we are headed and how we get there GIS Centroid Seminar — Colorado State University September 19, 2014 Basis “They who don’t know, don’t know they don’t know” Presentation Premise: There is a“map-ematics”that extends traditional math/stat concepts and procedures for thequantitative analysis of map variables(digital maps) …three major considerations will influence map analysis/modeling future development— Mathematical Framework, Data Structure and Educational Approach Presentation Premise: There is a“map-ematics”that extends traditional math/stat concepts and procedures for thequantitative analysis of map variables(digital maps) This PowerPoint with notes and online links to further reading is posted at www.innovativegis.com/basis/Present/CentroidCSU2014/ Presentation byJoseph K. Berry Adjunct Faculty in Natural Resources, Warner College of Natural Resources, Colorado State University Adjunct Faculty in Geosciences, Department of Geography, University of Denver Principal, Berry & Associates // Spatial Information Systems Email: jberry@innovativegis.com — Website: www.innovativegis.com/basis
Mapping vs. Analyzing (Processing Mapped Data) • …GISis a Technological Tool involving — • Mappingthat creates a spatial representation of an area • Displaythat generates visual renderings of a mapped area • Geo-querythat searches for map locations having a specified classification, condition or characteristic • …and an Analytical Tool involving — • Spatial Mathematics that applies scalar mathematical formulae to account for geometric positioning, scaling, measurement and transformations of mapped data • Spatial Analysis that investigates the contextual relationships within and among mapped data layers • Spatial Statistics that investigates the numerical relationships within and among mapped data layers “Map” “Analyze” Geographic Information Systems (map and analyze) (Descriptive Mapping) (Prescriptive Modeling) Global Positioning System (locate and navigate) Remote Sensing (measure and classify) GPS/GIS/RS (Biotechnology) (Nanotechnology) (Berry)
GIS as a Technological Tool (Critical Technological Frontiers) 3D Integration -- highly detailed 3D city models provide entirely new perspectives and realism supporting greater intuitive interaction with maps and improved understanding of spatial context. Intelligent 3D Models through the combination of GIS, CAD and BIM (Building Information Management) enabled by greater interoperability of data formats will be extended to other applications, such as forestry and natural resources management thereby translating the “What and Where” information into a seamless whole. Real-Time GIS -- the ever expanding sensor web provides the foundation for real-time GIS. Emergency response and military geospatial intelligence offer “situational awareness” for fast and effective response. Real-time GIS-enabled instruments are being coupled with automated devices, such as water levee gates and earthquake warning broadcast systems, for near instantaneous response. Incorporating the multiple data streams from live video, ground sensors, tracking devices, drone aircraft and space-based instruments within a GIS framework enable both Intelligent Agents (automated devices) and decision makers to “see What is Happening Where” and respond events as they unfold. -- Temporal GIS incorporates the X, Y and Z dimensions as well as time for a 4D representation that introduces the time element to geospatial datato account for changes over time (in-situ evolution as well as positioning displacement of moving elements). Inroads have been made to display time series animation of spatial data (such as the Doppler Radar Images of a moving storm front), but the move toward fully integrated and comprehensive temporal GIS is hindered by the enormous amount of data needed to bring about the vision. However, the algorithms and methods for basic Change Detection in multiple images of the same scene taken at different times has greatly matured but need to be easier to use and more intuitive. Temporal GIS Tomorrow’s Cyber Farmer (Precision Agriculture/Conservation example) …to pull off these amazing technological feats, significant advances in Map Analysis/Modelingcapabilities and acceptance are needed. However, for the most part, there’s a big disconnect between maps as interface and the rich understanding that can be had by thinking “map-ematically”. Three major considerations will influence map analysis/modeling future development—Mathematical Framework, Data Structure and Educational Approach. …based on Matt Ball's blog at http://www.sensysmag.com/spatialsustain/what-are-some-of-the-technological-frontiers-for-gis-advancement.html (Berry)
A Mathematical Structure for Map Analysis/Modeling GeotechnologyRS – GIS – GPS Technological Tool Analytical Tool (Continuous, Map Surfaces) Map Analysis/Modeling Mapping/Geo-Query(Discrete, Spatial Objects) Geo-registered Analysis Frame Map Stack Matrix of Numbers “Map-ematics” Maps as Data, not Pictures Vector & Raster — Aggregated & Disaggregated Qualitative &Quantitative …organized set of numbers Grid-based Map Analysis Toolbox Spatial Analysis Operations Spatial Statistics Operations A Map-ematical Framework Traditional math/stat procedures can be extended into geographic space to support Quantitative Analysis of Mapped Data “…thinking analytically with maps” Esri Spatial Analyst operations …over 170 individual “tools” www.innovativegis.com/basis/BeyondMappingSeries/, Book IV, Topic 9 for more discussion (Berry)
Spatial Analysis Operations(Geographic Context) GIS as “Technical Tool” (Where is What) vs. “Analytical Tool” (Why, So What and What if) Map Stack Grid Layer Spatial Analysis Spatial Analysisextends the basic set of discrete map features (points, lines and polygons) to map surfaces that represent continuous geographic space as a set of contiguous grid cells (matrix), thereby providing a Mathematical Framework for map analysis and modeling of the Contextual Spatial Relationships within and among grid map layers Mathematical Perspective: Basic GridMath & Map Algebra ( + - * / ) Advanced GridMath (Math, Trig, Logical Functions) Map Calculus (Spatial Derivative, Spatial Integral) Map Geometry (Euclidian Proximity, Effective Proximity, Narrowness) Plane Geometry Connectivity (Optimal Path, Optimal Path Density) Solid Geometry Connectivity (Viewshed, Visual Exposure) Unique Map Analytics (Contiguity, Size/Shape/Integrity, Masking, Profile) Map Analysis Toolbox Unique spatial operations (Berry)
Spatial Analysis Operations(Math Examples) Spatial Derivative Advanced Grid Math —Math, Trig, Logical Functions MapSurface 2500’ …is equivalent to the slope of thetangent plane at a location Map Calculus —Spatial Derivative, Spatial Integral 500’ The derivativeis the instantaneous “rate of change” of a function and is equivalent to the slope of thetangent line at a point Surface Fitted Plane Slope draped over MapSurface Curve SLOPE MapSurfaceFitted FOR MapSurface_slope 65% Spatial Integral Dzxy Elevation 0% ʃ Districts_AverageElevation …summarizes the values on a surface for specified map areas (Total= volume under the surface) Advanced Grid Math Surface Area COMPOSITE Districts WITH MapSurface Average FOR MapSurface_Davg …increases with increasing inclination as a Trig function of the cosine of the slope angle MapSurface_Davg S_Area= Fn(Slope) S_area= cellsize / cos(Dzxy Elevation) Surface Theintegral calculates the area under the curve for any section of a function. Curve (Berry)
Spatial Analysis Operations(Distance Examples) 96.0minutes …farthest away by truck, ATV and hiking Map Geometry —(Euclidian Proximity, Effective Proximity, Narrowness) Plane Geometry Connectivity —(Optimal Path, Optimal Path Density) Solid Geometry Connectivity—(Viewshed, Visual Exposure) HQ(start) Distance Euclidean Proximity Effective Proximity Off Road Relative Barriers On Road 26.5minutes …farthest away by truck Off Road Absolute Barrier On + Off Road Travel-Time Surface Farthest (end) Plane Geometry Connectivity HQ (start) Shortest straight line between two points… …from a point to everywhere… …not necessarily straight lines (movement) Truck = 18.8 min ATV = 14.8 min Hiking = 62.4 min …like a raindrop, the “steepest downhill path” identifies the optimal route (Quickest Path) Solid Geometry Connectivity Rise Visual Exposure Run Tan = Rise/Run • Counts • # Viewers Seen if new tangent exceeds all previous tangents along the line of sight Sums Viewer Weights Splash Highest Weighted Exposure 270/621= 43% of the entire road network is connected Viewshed (Berry)
Spatial Statistics Operations(Numeric Context) GIS as “Technical Tool” (Where is What) vs. “Analytical Tool” (Why, So What and What if) Map Stack Grid Layer Spatial Statistics Spatial Statisticsseeks to map the variation in a data set instead of focusing on a single typical response (central tendency), thereby providing a Statistical Framework for map analysis and modeling of the Numerical Spatial Relationships within and among grid map layers Statistical Perspective: Basic Descriptive Statistics (Min, Max, Median, Mean, StDev, etc.) Basic Classification(Reclassify, Contouring, Normalization) Map Comparison (Joint Coincidence, Statistical Tests) Unique Map Statistics (Roving Window and Regional Summaries) Surface Modeling (Density Analysis, Spatial Interpolation) Advanced Classification (Map Similarity, Maximum Likelihood, Clustering) Predictive Statistics (Map Correlation/Regression, Data Mining Engines) Map Analysis Toolbox Unique spatial operations (Berry)
Spatial Statistics (Linking Data Space with Geographic Space) Roving Window (weighted average) Spatial Distribution Geo-registered Sample Data Spatial Statistics Continuous Map Surface Discrete Sample Map Non-Spatial Statistics Surface Modeling techniques are used to derive a continuous map surface from discrete point data– fits a Surface to the data (maps the variation). Standard Normal Curve Average = 22.6 …lots of NE locations exceed Mean + 1Stdev In Geographic Space, the typical value forms a horizontal plane implying the average is everywhere StDev = 26.2 (48.8) X + 1StDev = 22.6 + 26.2 = 48.8 Histogram In Data Space, a standard normal curve can be fitted to the data to identify the “typical value” (average) X= 22.6 80 0 30 40 50 60 70 10 20 Unusually high values Numeric Distribution +StDev Average (Berry)
Spatial Statistics Operations(Data Mining Examples) Map Clustering: Elevation vs. Slope Scatterplot Cluster 2 “data pair” of map values …as similar as can be WITHIN a cluster …and as different as can be BETWEEN clusters “data pair” plots here in… Data Space Elevation (Feet) Geographic Space Slope draped on Elevation + + Cluster 1 Slope Slope (Percent) Elev X axis = Elevation (0-100 Normalized) Y axis = Slope (0-100 Normalized) Geographic Space Advanced Classification (Clustering) Data Space Map Correlation: Spatially Aggregated Correlation Scalar Value– one value represents the overall non-spatial relationship between the two map surfaces Roving Window r = .432 Aggregated …1 large data table with 25rows x 25 columns = 625 map values for map wide summary Map of the Correlation Entire Map Extent Elevation (Feet) r = …where x = Elevation value and y = Slope value and n = number of value pairs …625 small data tables within 5 cell reach = 81map values for localized summary Slope (Percent) Localized Correlation Map Variable– continuous quantitative surface represents the localized spatial relationship between the two map surfaces Predictive Statistics (Correlation) (Berry)
Grid-based Map Data Structure (geo-registered matrix of map values) 2.50 Latitude/Longitude Grid (140mi grid cell size) 90 Analysis Frame (grid “cells”) 300 Grid Lines Coordinate of first grid cell is 900 N 00 E #Rows= 73 #Columns= 144 = 10,512 grid cells Conceptual Spreadsheet(73 x 144) The Latitude/Longitude grid forms a continuous surface for geographic referencing where eachgrid cell represents a given portion of the earth’ surface. Lat/Lon …each 2.50grid cell is about 140mi x 140mi 18,735mi2 The easiest way to conceptualize a grid map is as an Excel spreadsheet with each cell in the table corresponding to a Lat/Lon grid space (location) and each value in a cell representing the characteristic or condition (information) of a mapped variable occurring at that location. …from Lat/Lon “crosshairs to grid cells” that contain map valuesindicating characteristics or conditions at each grid location …maximum Lat/Lon decimal degree resolution is a four-inch square anywhere in the world …the bottom line is that… All spatial topology is inherent in the grid. (Berry)
Universal Database Key (moving Lat/Lon from crosshairs to grid cells) …Spatially Keyed data in the cloud are downloaded and configured to the Analysis Frame defining the Map Stack Lat/Lon serves as a Universal dB Key for joining data tables based on location Spatially Keyed data in the cloud Conceptual Organization RDBMS Organization Spreadsheet 30m Elevation (99 columns x 99 rows) “Where” Wyoming’s Bighorn Mts. Database Keystone Concept Each of the conceptual grid map spreadsheets (matrices) can be converted to interlaced RDBMS formatwith a long string of numbers forming the data field (map layer) and the records (values) identifying the information at each of the individual grid cell locations. Geographic Space Grid Space 2D Matrix 1D Field Database Table Lat/Lon as a Universal Spatial Key Elevation Surface Once a set of mapped data is stamped with its Lat/Lon “Spatial Key,” it can be linked to any other database table with spatially tagged records without the explicit storage of a fully expanded grid layer— all of the spatial relationships are implicit in the relative Lat/Lon positioning. Data Space Each column (field) represents a single map layer with the values in the rows indicating the characteristic or condition at each grid cell location (record) “What” (Berry)
5-step Process for Unlocking the Universal Spatial Db Key Spatially Aware Database (XY, Value) Step 1. User identifies the geographic extent of the analysis window. Step 2. User specifies thecell size of the analysis window. …e.g., 100m Where(XY) …Lat/Lon coordinates identify earth position of a dB record 3 6 7 0 What(Value) …value indicates characteristic or condition at a location 1 8 Longitude 11 4 4 9 0 15 7 13 7 20 9 Latitude Step 3. Computer determines the Lat/Lon ranges defining each grid cell (cutoffs) and the centroid location. …defines the Analysis Frame 3 2 7 2 1 13 6 12 11 0 10 3 4 16 5 2 6 1 Step 4. Computer determines the appropriate grid cellfor each database record that falls within the analysis frame’s geographic extent based on its Lat/Lon coordinates… then repeats for all selected dB records. Map Stack Step 5. Computer summarizes the values if more than one value “falls” into an individual grid cell-- result is a “Grid Map Layer” for inclusion in a map stack for subsequent map analysis. Analysis Frame (grid map layer) …but Lat/Lon grid cells are only square at the equator— so is the entire idea a bust? Shish Kebab of numbers Hint: spatial resolution of the analysis frame is key (Berry)
Revisit Analytics (2020s) GeoWeb (2000s) Revisit Geo-reference (2010s) Map Analysis (1990s) Mapping focus Data/Structure focus Analysis focus GIS Development Cycle(…where we’re heading) Future Directions GIS Evolution 2D Planar (X,Y Data) 3D Solid (X,Y,Z Data) Future Directions Cartesian Coordinates Today Today Square (4 sides) Cube (6 squares) Contemporary GIS Future Future Spatial dB Mgt (1980s) Pentagonal Dodecahedral (12 pentagons) Hexagon (6 sides) The Early Years …about every decade The Early Years Computer Mapping (1970s) (Berry)
GIS Education(shifting the current Technical focus to a Pedagogical focus) The lion’s share of the growth has been GIS’s ever expanding capabilities as a “technical tool” for corralling vast amounts of spatial data and providing near instantaneous access to remote sensing images, GPS navigation, interactive maps, asset management records, geo-queries and awesome displays. However, GIS as an “analytical tool” hasn’t experienced the same meteoric rise— in fact it can be argued that the analytic side of GIS has somewhat stalled… partly because of… …but modern digital “maps are numbers first, pictures later” and we do mathematical and statistical things to map variables that moves GIS from— “WhereisWhat”graphical inventories, to a “Why, So What and What If” problem solving environment— “thinking analytically with maps” (Berry)
The “-ists” and the “-ologists” Together the “-ists” and the “-ologists” frame and develop the Solution for an application. The“-ists” The“-ologists” — and — …understand the “tools” that can be used to display, query and analyze spatial data Data and Information focus …understand the “science” behind spatial relationships that can be used for decision-making Knowledge and Wisdom focus Application Space Geotechnology’s Core “-ists” “-ologists” Solution Space Technology Experts Domain Experts GIS Expertise Spatial Reasoning Where is What Why, So What, What If (Berry)
The “-ists” and the “-ologists” (toward a much bigger tent) …Decision Makers utilize the Solution… …under Stakeholder, Policy & Public auspices “Public” “Policy Makers” “Stakeholders” “Decision Makers” Application Space Geotechnology’s Core “-ists” “-ologists” …and complicating GIS Technology We are simultaneously trivializing… Solution Space Technology Experts Domain Experts Spatial Reasoning GIS Expertise (Berry)
Conclusions/Upshot(moving away from your grandfather's map) Tomorrow’s GIS arena will be radically differentfrom the past four decades… – automated the cartographic process where points, lines and areas (spatial objects) defining geographic features on a map are represented as an organized set of X,Y coordinates. – linked computer mapping capabilities with traditional database management capabilities by assigning an ID# to each spatial object that serves as a common database key between a spatial table (Where) and an attribute table (What). – developed a comprehensive theory of map analysis where spatial information is represented numerically as continuous spatial distributions (raster), rather than in graphic fashion as discrete spatial objects (vector) identified by inked lines on a map. These digital maps are frequently conceptualized as a set of "floating maps" with a common registration, allowing the computer to "look" down and across the stack of digital maps to characterize spatial relationships of the mapped data that can be summarized (database queries) or mathematically manipulated (analytic processing). – the Internet has moved maps and mapping from a “down the hall and to the right” specialist’s domain, to everyone’s desktop, notebook and mobile device. While the bulk of these applications involve navigation, mapping and geo-query (technological), they have fully established the digital map beachhead that sees “maps as data, not just images.” Computer Mapping(1970 to 1980) Spatial Database Management Systems(1980 to 1990) Map Analysis and GIS Modeling(1990 to 2000) GeoWeb and Mobile Devices(2000 to 2010) In the future, Geotechnology will fully exploit its numerical characterby extending… 1) Scientific Use of Spatial Data– SpatialSTEM education will infuse science with “analytical tools” for unlocking radically new understandings of spatial patterns and relationships in their research. 2) Spatial Solutions to Devices– “map-ematical solutions” will be directly tied to automated devices through continued coupling of RS, GIS, GPS and robotics. 3) Spatial Reasoning and Dialog– GIS models will enable decision-makers to interactively investigate and better communicate “Why, So What and What If” of the probable spatial outcomes/impacts of critical decisions. Ag&NRconsiderations …next time …quantitative mapped data analysis and modeling completely changes our perspective of “what a map is (and isn’t)” See http://www.innovativegis.com/basis/BeyondMappingSeries/BeyondMapping_I/Epilog/BM_I_Epilog.htmfor more discussion (Berry)
So Where to Head from Here? Online Materials (www.innovativegis.com/Basis/Courses/SpatialSTEM/) ) Website (www.innovativegis.com) For more papers and presentations on Geotechnology www.innovativegis.com This PowerPoint with notes and online links to further reading is posted at www.innovativegis.com/basis/Present/CentroidCSU2014/ Beyond Mapping Compilation Series …nearly 1000 pages and more than 750 figures in the Series provide a comprehensive and longitudinal perspective of the underlying concepts, considerations, issues and evolutionary development of modern geotechnology (RS, GIS, GPS). eMail Contact Joseph K. Berry jberry@innovativegis.com