Download
1 / 21
220 likes | 437 Views
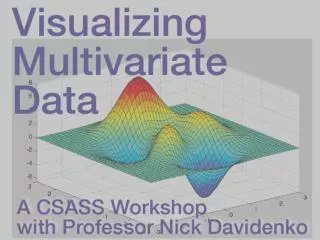
Scatter plots & Association. Statistics is about … variation. Recognize, quantify and try to explain variation. Variation in contents of cola cans can be explained, in part, by the type of cola in the cans. Scatter plots & Association. Response variable – variable of primary interest.

E N D
Scatter plots & Association • Statistics is about … variation. • Recognize, quantify and try to explain variation. • Variation in contents of cola cans can be explained, in part, by the type of cola in the cans.
Scatter plots & Association • Response variable – variable of primary interest. • Explanatory variable – variable used to try to explain variation in the response.
Scatter plots & Association • When both the response and the explanatory variables are quantitative, display them both in a scatter plot. • Look for a general pattern of association.
Scatter plots & Association • Example: Tar (mg) and carbon monoxide (mg) in cigarettes. • y, Response: CO (mg). • x, Explanatory: Tar (mg). • Cases: 25 brands of cigarettes.
Positive Association • Above average values of CO are associated with above average values of Tar. • Below average values of CO are associated with below average values of Tar.
Scatter plots & Association • Example: Outside temperature and amount of natural gas used. • Response: Natural gas (1000 ft3). • Explanatory: Outside temperature (o C). • Cases: 26 days.
Negative Association • Above average values of gas are associated with below average temperatures. • Below average values of gas are associated with above average temperatures.
Correlation • Linear Association • How closely do the points on the scatter plot represent a straight line? • The correlation coefficient gives the direction of the linear association and quantifies the strength of the linear association between two quantitative variables.
Correlation • Standardize y • Standardize x
ZxZy > 0 ZxZy > 0
Correlation Conditions • Correlation applies only to quantitative variables. • Correlation measures the strength of linear association. • Outliers can distort the value of the correlation coefficient.
Correlation Coefficient • Tar and CO • r = 0.9575
Correlation Coefficient • There is a strong positive correlation, linear association, between the tar content and carbon monoxide content of the various cigarette brands.
JMP • Analyze – Multivariate methods – Multivariate • Y, Columns • Tar (mg) • CO (mg)
Correlation Properties • The sign of r indicates the direction of the association. • The value of r is always between –1 and +1 • Correlation has no units. • Correlation is not affected by changes of center or scale.
Correlation Cautions • “Correlation” and “Association” are different. • Correlation – specific (linear). • Association – vague (trend). • Don’t correlate categorical variables.
Correlation Cautions • Don’t confuse correlation with causation. • There is a strong positive correlation between the number of crimes committed in communities and the number of 2nd graders in those communities. • Beware of lurking variables.