Download
1 / 15
160 likes | 277 Views
Investigating Scatter Plots with lines of best fit. 5.6. Investigating Scatter Plots. Investigating Scatter Plots. Scatter plots are similar to line graphs in that each graph uses the horizontal ( x ) axis and vertical ( y ) axis to plot data points.

E N D
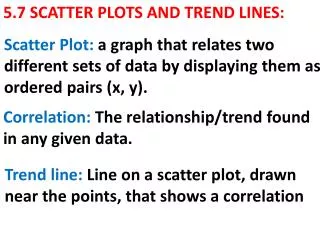
Investigating Scatter Plots • Scatter plots are similar to line graphs in that each graph uses the horizontal ( x ) axis and vertical ( y ) axis to plot data points. • Scatter plots are most often used to show correlations or relationships among data.
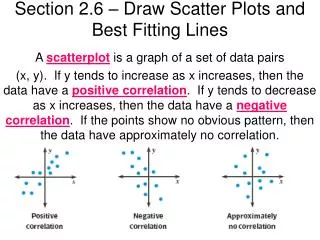
Investigating Scatter Plots • Positive correlations occur when two variables or values move in the same direction. • As the number of hours that you study increases your overall class grade increases
Investigating Scatter Plots • Negative Correlations occur when variables move in opposite directions • As the number of days per month that you exercise increases your actual weight decreases
Investigating Scatter Plots • No correlation exists if there is no noticeable pattern in the data • There is no relationship between the number of shirts someone owns and their annual salary
Line of Best Fit • A line of best fit is a line that best represents the data on a scatter plot. • A line of best fit may also be called a trend line since it shows us the trend of the data • The line may pass through some of the points, none of the points, or all of the points. • The purpose of the line of best fit is to show the overall trend or pattern in the data and to allow the reader to make predictions about future trends in the data.
Using Excel to Create Scatter Plots • Insert height and foot length data
Things to remember • A scatter plot with a positive correlation has X and Y values that rise together. • A scatter plot with a negative correlation has X values that rise as Y values decrease • A scatter plot with no correlation has no visible relationship • The line of best fit is the line that best shows the trend of the data