Download
1 / 6
60 likes | 200 Views
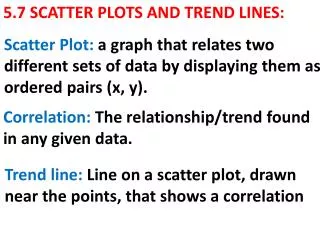
Scatter plots, relationships, and Trend lines. Objective: Learn to read and interpret scatter plots. Learn to make scatter plots. Learn to draw trend lines. Scatter plots are used to investigate the relationship between two sets of numbers. A scatter plot with a POSITIVE RELATIONSHIP.

E N D
Scatter plots, relationships, and Trend lines Objective: Learn to read and interpret scatter plots. Learn to make scatter plots. Learn to draw trend lines.
Scatter plots are used to investigate the relationship between two sets of numbers. A scatter plot with a POSITIVE RELATIONSHIP A scatter plot with a NEGATIVE RELATIONSHIP • When 2 sets of data increase at the same time, the sets show a positive relationship. A scatter plot of a positive relationship slants upward to the right. When 1 set of data increases as the other decreases, the set shows a negative relationship. A scatter plot of a negative relationship slants downward to the right.
When 2 sets of data neither increase nor decrease together, they show no relationship • When sets of data show a positive or negative relationship, you can draw a trend line to approximate the data. • By extending the trend line you can make predictions about the future.
Steps to drawing a scatter plot: 1. Choose a scale. 2. Mark the interval on each axis. 3. Label both axes. 4. Plot the points. 5. What kind of relationship does the scatter plot show?6. Draw a trend line. Your Example: Draw a scatter plot and a trend line for this data.
Homework: Scatter plots Determine whether each data set shows a positive, a negative, or no relationship.
Homework: You also have to bring the M&M bag and any materials you might need for tomorrow!! We start our project!!!!!