Download
1 / 64
640 likes | 829 Views
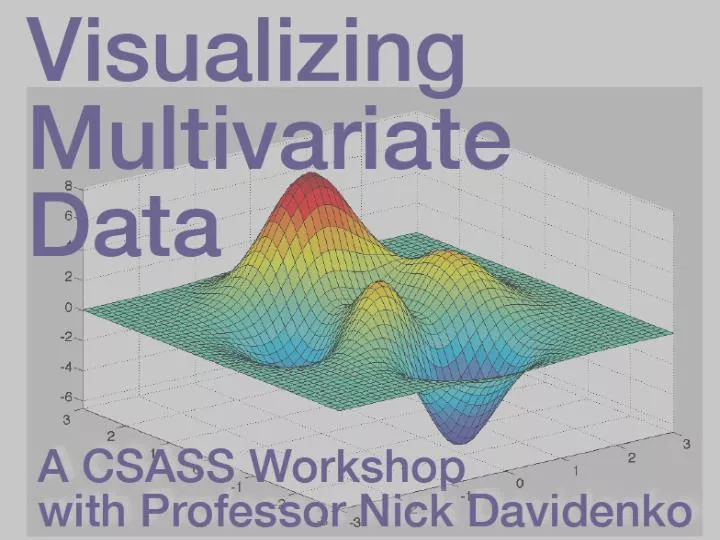
Plan for today. An example with 3 variables Face ratings 1: age, gender, and attractiveness Histograms and scatter plots Using symbols and colors to visually segment data Full and partial correlations 3D scatter plots Understanding intransitive correlations

E N D
Plan for today • An example with 3 variables Face ratings 1: age, gender, and attractiveness • Histograms and scatter plots • Using symbols and colors to visually segment data • Full and partial correlations • 3D scatter plots • Understanding intransitive correlations Face ratings 2: dominance, neoteny, and attractiveness • 3D scatter plots • Stepwise and full regression • Fully crossed data • Surface plots • Time permitting: simplifying high-dimensional data • Principal components analysis (PCA)
Face ratings (with Corinne Olafsen ’14) Gender? Age? Attractiveness? 76 raters x 276 faces x 3 characteristics
Face ratings (with Corinne Olafsen ’14) Mean data across 76 raters 279 faces : 3 characteristics
Exploratory look at the data: histograms • In Matlab: >> age2 = [2.0517 1.6724 2.0517 … 3.9138]; >> gender2 = [38.1034 28.2759 37.7586 … 38.9655]; >> attr2 = [2.1429 2.3143 1.6571 … 1.7714];
Exploratory look at the data: histograms • In Matlab: >> age2 = [2.0517 1.6724 2.0517 … 3.9138]; >> gender2 = [38.1034 28.2759 37.7586 … 38.9655]; >> attr2 = [2.1429 2.3143 1.6571 … 1.7714]; >> figure(101) >> hist(age2);
Exploratory look at the data: histograms • In Matlab: >> age2 = [2.0517 1.6724 2.0517 … 3.9138]; >> gender2 = [38.1034 28.2759 37.7586 … 38.9655]; >> attr2 = [2.1429 2.3143 1.6571 … 1.7714]; >> figure(102) >> hist(gender2);
Exploratory look at the data: histograms • In Matlab: >> age2 = [2.0517 1.6724 2.0517 … 3.9138]; >> gender2 = [38.1034 28.2759 37.7586 … 38.9655]; >> attr2 = [2.1429 2.3143 1.6571 … 1.7714]; >> figure(103) >> hist(attr2);
3D Histograms! • In Matlab: >> age2 = [2.0517 1.6724 2.0517 … 3.9138]; >> gender2 = [38.1034 28.2759 37.7586 … 38.9655]; >> attr2 = [2.1429 2.3143 1.6571 … 1.7714]; >> figure(104) >> hist(age2, gender2); >> xlabel(‘Age’); ylabel(‘Gender’);
Looking at 2 variables at a time • Pairwise scatter plots • In Matlab: >> age2 = [2.0517 1.6724 2.0517 … 3.9138]; >> gender2 = [38.1034 28.2759 37.7586 … 38.9655]; >> attr2 = [2.1429 2.3143 1.6571 … 1.7714];
Looking at 2 variables at a time • Pairwise scatter plots • In Matlab: >> age2 = [2.0517 1.6724 2.0517 … 3.9138]; >> gender2 = [38.1034 28.2759 37.7586 … 38.9655]; >> attr2 = [2.1429 2.3143 1.6571 … 1.7714]; (1) Attractiveness versus Gender In Matlab: >> figure(1); set(gca,'fontsize',16); >> plot(gender2, attr2, '.k'); >> xlabel('Gender (1=f, 4=m)') >> ylabel('Attractiveness (1-4)’)
Looking at 2 variables at a time • Pairwise scatter plots • In Matlab: >> age2 = [2.0517 1.6724 2.0517 … 3.9138]; >> gender2 = [38.1034 28.2759 37.7586 … 38.9655]; >> attr2 = [2.1429 2.3143 1.6571 … 1.7714]; (1) Attractiveness versus Gender In Matlab: >> figure(1); set(gca,'fontsize',16); >> plot(gender2, attr2, '.k'); >> xlabel('Gender (1=f, 4=m)') >> ylabel('Attractiveness (1-4)’)
Looking at 2 variables at a time • Pairwise scatter plots • In Matlab: >> age2 = [2.0517 1.6724 2.0517 … 3.9138]; >> gender2 = [38.1034 28.2759 37.7586 … 38.9655]; >> attr2 = [2.1429 2.3143 1.6571 … 1.7714]; (2) Attractiveness versus Age In Matlab: >> figure(2); set(gca,'fontsize',16); >> plot(age2, attr2, '.k'); >> xlabel(’Age (years)') >> ylabel('Attractiveness (1-4)’)
Looking at 2 variables at a time • Pairwise scatter plots • In Matlab: >> age2 = [2.0517 1.6724 2.0517 … 3.9138]; >> gender2 = [38.1034 28.2759 37.7586 … 38.9655]; >> attr2 = [2.1429 2.3143 1.6571 … 1.7714]; (2) Attractiveness versus Age In Matlab: >> figure(2); set(gca,'fontsize',16); >> plot(age2, attr2, '.k'); >> xlabel(’Age (years)') >> ylabel('Attractiveness (1-4)’)
Looking at 2 variables at a time • Pairwise scatter plots • In Matlab: >> age2 = [2.0517 1.6724 2.0517 … 3.9138]; >> gender2 = [38.1034 28.2759 37.7586 … 38.9655]; >> attr2 = [2.1429 2.3143 1.6571 … 1.7714]; (3) Age versus Gender In Matlab: >> figure(3); set(gca,'fontsize',16); >> plot(gender2, age2, '.k'); >> xlabel(’Gender (1=f, 4=m)’) >> ylabel(’Age (years)')
Looking at 2 variables at a time • Pairwise scatter plots • In Matlab: >> age2 = [2.0517 1.6724 2.0517 … 3.9138]; >> gender2 = [38.1034 28.2759 37.7586 … 38.9655]; >> attr2 = [2.1429 2.3143 1.6571 … 1.7714]; (3) Age versus Gender In Matlab: >> figure(3); set(gca,'fontsize',16); >> plot(gender2, age2, '.k'); >> xlabel(’Gender (1=f, 4=m)’) >> ylabel(’Age (years)')
Breaking it down • Attractiveness versus age (using different symbols for gender) In Matlab: >> figure(801); set(gca,'fontsize',16); >> m2 = find(gender2>2.5); >> plot(age2(m2),attr2(m2),'.b', 'markersize',25); >> hold on >> f2 = find(gender2<=2.5); >> plot(age2(f2),attr2(f2),'.r', 'markersize',25); >> xlabel('Age'); ylabel('Attractiveness (1-4)'); >> legend({'male' 'female'});
Breaking it down • Attractiveness versus age (using different symbols for gender) In Matlab: >> figure(801); set(gca,'fontsize',16); >> m2 = find(gender2>2.5); >> plot(age2(m2),attr2(m2),'.b', 'markersize',25); >> hold on >> f2 = find(gender2<=2.5); >> plot(age2(f2),attr2(f2),'.r', 'markersize',25); >> xlabel('Age'); ylabel('Attractiveness (1-4)'); >> legend({'male' 'female'});
Breaking it down • Attractiveness versus gender (using different symbols for gender) In Matlab: >> figure(802); set(gca,'fontsize',16); >> plot(gender2(m2),attr2(m2),'.b', 'markersize',25); >> hold on >> plot(gender2(f2),attr2(f2),'.r', 'markersize',25); >> xlabel(’Gender'); ylabel('Attractiveness (1-4)');
Breaking it down • Attractiveness versus gender (using different symbols for gender) In Matlab: >> figure(802); set(gca,'fontsize',16); >> plot(gender2(m2),attr2(m2),'.b', 'markersize',25); >> hold on >> plot(gender2(f2),attr2(f2),'.r', 'markersize',25); >> xlabel(’Gender'); ylabel('Attractiveness (1-4)');
Breaking it down • Correlations between gender and attractiveness? Overall: >> [rp] = corr(gender2, attr2) r = -0.2797 p = 2.3604e-06
Breaking it down • Correlations between gender and attractiveness? Overall: >> [rp] = corr(gender2, attr2) r = -0.2797 p = 2.3604e-06 Just males: >> [rp] = corr(gender2(m2), attr2(m2)) r = 0.0307 p = 0.7028
Breaking it down • Correlations between gender and attractiveness? Overall: >> [rp] = corr(gender2, attr2) r = -0.2797 p = 2.3604e-06 Just males: >> [rp] = corr(gender2(m2), attr2(m2)) r = 0.0307 p = 0.7028 Just females: >> [rp] = corr(gender2(f2), attr2(f2)) r = -0.5560 p = 5.2062e-11
Putting it all together with color Hue Gender Brightness Age >> figure(804); clf; set(gcf,'color','w'); set(gca,'fontsize',16); >> for i=1:length(m2) markercolor = [0 0 1-age2(m2(i))-min(age2(m2)))/(max(age2(m2))-min(age2(m2)))]; plot(gender2(m2(i)),attr2(m2(i)),'.', 'markersize',35,'color’,markercolor); hold on >> end >> for i=1:length(f2) markercolor = [1-age2(f2(i))-min(age2(f2)))/(max(age2(f2))-min(age2(f2))) 0 0]; plot(gender2(f2(i)),attr2(f2(i)),'.', 'markersize',35,'color' ,’markercolor’); >> end >> xlabel('Gender');ylabel('Attractiveness');
Putting it all together with color Blue = Male Red = Female Brighter = younger Darker = older
3D scatter plots >> figure(803); clf; set(gcf,'color','w'); set(gca,'fontsize',16); >> plot3(age2,gender2,attr2, '.k’) >> xlabel('Age'); ylabel('Gender');zlabel('Attractiveness'); Figure 803
3D scatter plots with colors >> figure(805); clf; set(gcf,'color','w'); set(gca,'fontsize',16); for i=1:length(m2) markercolor = [0 0 1-(age2(m2(i))-min(age2(m2)))/(max(age2(m2))-min(age2(m2)))]; plot3(age2(m2(i)),gender2(m2(i)),attr2(m2(i)),'.', 'markersize',25,'color',markercolor); hold on end for i=1:length(f2) markercolor = [1-(age2(f2(i))-min(age2(f2)))/(max(age2(f2))-min(age2(f2))) 0 0]; plot3(age2(f2(i)),gender2(f2(i)),attr2(f2(i)),'.', 'markersize',25, 'color',markercolor) end xlabel('Age'); ylabel('Gender');zlabel('Attractiveness'); Figure 805
New example:Dominance, neoteny, and attractiveness (with Brianna Jeska ’15)
New example:Dominance, neoteny, and attractiveness (with Brianna Jeska ’15) • Predictions: • Dominance attractiveness • Neoteny attractiveness • But dominance is negatively related to neoteny (???)
Dominance, neoteny, and attractiveness Data: 13 raters x 39 faces x 3 characteristics Mean data across 13 raters 39 faces : 3 characteristics
Dominance, neoteny, and attractiveness • In Matlab: • >> dom = [4.2308 • 4.4615 • 3.0769 • … • 4.3077]; • >> neot = [3.6154 • 2.9231 • 2.7692 • … • 3.6923]; • >> attr = [3.7692 • 2.9231 • 2.6923 • … • 3.0769];
Pairwise scatter plots and correlations Attractiveness vs. neoteny In Matlab: >> figure(1); set(gca,'fontsize',16); >> plot(dom,attr,'.k'); >> xlabel('Neoteny') >> ylabel('Attractiveness'); >> [r p] = corr(neot,attr) r = 0.2359 p = 0.1483 marginally correlated
Pairwise scatter plots and correlations Attractiveness vs. dominance In Matlab: >> figure(2); set(gca,'fontsize',16); >> plot(neot,attr,'.k'); >> xlabel('Dominance') >> ylabel('Attractiveness'); >> [r p] = corr(dom,attr) r = 0.5251 p = 5.9848e-04 strongly correlated
Pairwise scatter plots and correlations Neoteny vs. dominance? In Matlab: >> figure(3); set(gca,'fontsize',16); >> plot(dom,neot,'.k'); >> xlabel('Dominance') >> ylabel('Neoteny'); >> [r p] = corr(dom,neot) r = -0.5032 p = 0.0011 negatively correlated!
3D scatter plots >> figure(4); set(gca,'fontsize',16); >> plot3(dom,neot,attr,'.k'); >> xlabel('Dominance'); ylabel('Neoteny'); zlabel('Attractiveness'); Figure 4
3D scatter plots >> figure(4); set(gca,'fontsize',16); >> plot3(dom,neot,attr,'.k'); >> xlabel('Dominance'); ylabel('Neoteny'); zlabel('Attractiveness'); Figure 4 >> view([0 0]) attr vs. dom
3D scatter plots >> figure(4); set(gca,'fontsize',16); >> plot3(dom,neot,attr,'.k'); >> xlabel('Dominance'); ylabel('Neoteny'); zlabel('Attractiveness'); Figure 4 >> view([90 0]) attr vs. neot
3D scatter plots >> figure(4); set(gca,'fontsize',16); >> plot3(dom,neot,attr,'.k'); >> xlabel('Dominance'); ylabel('Neoteny'); zlabel('Attractiveness'); Figure 4 >> view([0 90]) neot vs. dom
Stepwise and full regression Stepwise regression model: >> stepwise([domneot],attr)
Stepwise and full regression Stepwise regression model: >> stepwise([domneot],attr) Full regression model: >> c = regress(attr,[domneot]) c = 0.6460 0.3284 (coefficients of dom and neot)
Stepwise and full regression Stepwise regression model: >> stepwise([domneot],attr) Full regression model: >> c = regress(attr,[domneot]) c = 0.6460 0.3284 (coefficients of dom and neot) >> y = c(1)*dom + c(2)*neot; >>figure(5); set(gca,'fontsize',16); >> plot(y,attr,'.'); >> xlabel('Attractivenesspredictor'); >> ylabel('Attractiveness');
Surface plots • Requirements: • 2 independent variables • Data for very combination of values on the independent variables • For example: a lexical decision task • IVs: • Orientation of the string (0°, 45°, 90°, 135°, 180°) • String length (3 letters, 4 letters, 5 letters, 6 letters) • DV: • Reaction time
Surface plots • Made up data:
Surface plots • Made up data: In Matlab: >> v = [1.25 1.23 1.32 1.4 1.42 1.41 1.45 1.48 1.43 1.53 1.54 1.59 1.78 1.81 1.91 2.03 2.15 2.33 1.6 1.68 1.63 1.81 2.32 2.71 2.89 2.98 2.9 1.86 1.89 1.83 2.01 2.41 2.99 3.25 3.49 3.78 2.01 1.98 2.07 2.48 3.02 3.79 4.08 4.3 4.28 2.34 2.45 2.6 3.15 3.87 4.03 4.52 4.86 4.69]; >> figure(11) >> surf(v)
Surface plots • Made up data: In Matlab: >> v = [1.25 1.23 1.32 1.4 1.42 1.41 1.45 1.48 1.43 1.53 1.54 1.59 1.78 1.81 1.91 2.03 2.15 2.33 1.6 1.68 1.63 1.81 2.32 2.71 2.89 2.98 2.9 1.86 1.89 1.83 2.01 2.41 2.99 3.25 3.49 3.78 2.01 1.98 2.07 2.48 3.02 3.79 4.08 4.3 4.28 2.34 2.45 2.6 3.15 3.87 4.03 4.52 4.86 4.69]; >> figure(11) >> surf(v) Figure 11
Surface plots • Made up data: In Matlab: >> v = [1.25 1.23 1.32 1.4 1.42 1.41 1.45 1.48 1.43 1.53 1.54 1.59 1.78 1.81 1.91 2.03 2.15 2.33 1.6 1.68 1.63 1.81 2.32 2.71 2.89 2.98 2.9 1.86 1.89 1.83 2.01 2.41 2.99 3.25 3.49 3.78 2.01 1.98 2.07 2.48 3.02 3.79 4.08 4.3 4.28 2.34 2.45 2.6 3.15 3.87 4.03 4.52 4.86 4.69]; >> figure(11) >> surf(v) OR >> figure(12); set(gca,'fontsize',16) >> a = [0:22.5:180]; >> wl = [3:8]; >> surf(a,wl,v); >> xlabel('Angle') >> ylabel('Word length') >> zlabel('Reaction time') Figure 12
Dimensionality reduction • Principal components analysis • A type of factor analysis, assuming normally distributed variables • Reduces high-dimensional data into a manageable number of dimensions
Dimensionality reduction • Principal components analysis • A type of factor analysis, assuming normally distributed variables • Reduces high-dimensional data into a manageable number of dimensions • Example: face space
Parameterizing silhouettes Davidenko, Journal of Vision, 2007
Parameterizing silhouettes Davidenko, Journal of Vision, 2007