Download
1 / 39
390 likes | 617 Views
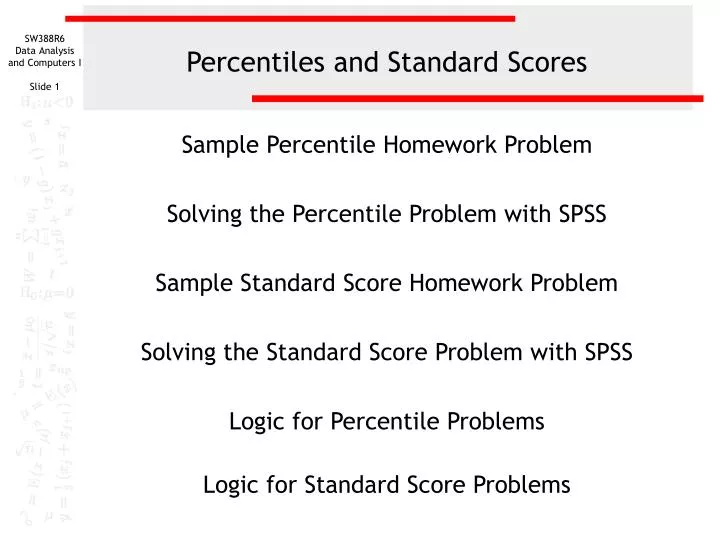
Percentiles and Standard Scores. Sample Percentile Homework Problem Solving the Percentile Problem with SPSS Sample Standard Score Homework Problem Solving the Standard Score Problem with SPSS Logic for Percentile Problems Logic for Standard Score Problems.

E N D
Percentiles and Standard Scores Sample Percentile Homework Problem Solving the Percentile Problem with SPSS Sample Standard Score Homework Problem Solving the Standard Score Problem with SPSS Logic for Percentile Problems Logic for Standard Score Problems
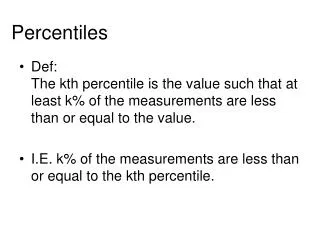
Homework problems: Percentiles - 1 Based on percentiles for the variable "occupational prestige score" [prestg80] in the dataset GSS2000R.Sav, is the following statement true, false, or an incorrect application of a statistic? A value of 66 for the variable "occupational prestige score" would position a survey respondent in the top 10% of cases in the data set. • True • True with caution • False • Incorrect application of a statistic This is the general framework for the problems in the homework assignment on percentiles and zscores. You will be asked whether or not a particular value or score can accurately be characterized as placing a subject in the top 5% or 10% of the cases in the dataset.
Homework problems: Percentiles - 2 Based on percentiles for the variable "occupational prestige score" [prestg80] in the dataset GSS2000R.Sav, is the following statement true, false, or an incorrect application of a statistic? A value of 66 for the variable "occupational prestige score" would position a survey respondent in the top 10% of cases in the data set. • True • True with caution • False • Incorrect application of a statistic • The first paragraph identifies: • The data set to use, e.g. GSS2000R.Sav • The statistic to use, e.g. percentile or zscore • The variable used in the analysis
Homework problems: Percentiles - 3 Based on percentiles for the variable "occupational prestige score" [prestg80] in the dataset GSS2000R.Sav, is the following statement true, false, or an incorrect application of a statistic? A value of 66 for the variable "occupational prestige score" would position a survey respondent in the top 10% of cases in the data set. • True • True with caution • False • Incorrect application of a statistic • The second paragraph identifies: • The value of the variable to test • The percentage expected for the value tested
Homework problems: Percentiles - 4 The answer to a problem will be True if the computed percentile for the tested value supports the finding in the problem statement. True with caution is not needed for percentile problems because percentiles are legitimate for ordinal level variables as well as interval level variables. Based on percentiles for the variable "occupational prestige score" [prestg80] in the dataset GSS2000R.Sav, is the following statement true, false, or an incorrect application of a statistic? A value of 66 for the variable "occupational prestige score" would position a survey respondent in the top 10% of cases in the data set. • True • True with caution • False • Incorrect application of a statistic The answer to a problem will be False if the computed percentile for the tested value does not support the finding in the problem statement. The answer to a problem will Incorrect application of a statistic if the computed statistic violates the level of measurement requirement, i.e. the variable is not ordinal or interval level.
Solving the problem with SPSS:Level of measurement The calculation of percentiles requires that the variable be ordinal or interval level. "Occupational prestige score" [prestg80] is interval, satisfying the requirement.
Solving the problem with SPSS: Computing percentiles - 1 Our first task in SPSS is to compute the percentiles for each case. To add the percentile value to each case in SPSS data set, select Rank Cases… from the Transform menu.
Solving the problem with SPSS: Computing percentiles - 2 First, select and move the variable prestig80 to the Variable(s) list box. Second, click on the Rank Types button to choose the method for rank ordering cases.
Solving the problem with SPSS: Computing percentiles - 3 Mark the check box for Fractional rank as %. This will compute the percentile for each of the values of the variable prestg80. Clear the check box for Rank, since this is information we do not need to solve the problem. Click on the Continue button to close the dialog box.
Solving the problem with SPSS: Computing percentiles - 4 Back in the Rank Cases dialog, click on the Ties button to specify the way rank is assigned to scores that have the same numeric values.
Solving the problem with SPSS: Computing percentiles - 5 Second, we click on the Continue button to close the dialog box. First, we mark the High option button. Since SPSS computes percentages at each rank by dividing the rank value by the total number of cases, this will give us the same percentages that we would get from a cumulative frequency distribution.
Solving the problem with SPSS: Computing percentiles - 6 First, click on the OK button to obtain the output.
Solving the problem with SPSS: Computing percentiles - 7 The output contains a summary of the command options we selected. The percentile values are added to the data set..
Solving the problem with SPSS: Sorting the percentiles - 1 Scroll the data set to the right to see the percentile variable, Pprestg8. We can identify the score it will take to be in the top 10% if we sort the data. Right click on the column header Pprestg8 and select Sort Descending from the popup menu.
Solving the problem with SPSS: Answering the question - 1 Being in the top 10% means that a case is in the 90th percentile or higher. Scroll down the data set until you locate the value that above the percentile that drops below 90. In this example, 87.84 is below the 90th percentile, so our answer is the value corresponding to the 92.16 percentile.
Solving the problem with SPSS: Answering the question - 2 Highlight the row corresponding to percentile 92.16 and scroll the data set to the left to locate the prestg80 variable. The value in the prestg80 column on the highlighted row is 65. A score of 65 (or higher) would position a survey respondent in the top 10% of the cases. The answer to the problem is True.
Removing the percentile variable We do not need the variable that SPSS created for percentiles, so we will remove it from the data set. First, click on the column header, Pprestg8, to select the variable to delete. Second, select the Clear command from the Edit menu, or press the Delete key on your keyboard.
Homework problems: Standard Scores - 1 Based on standard scores for the variable "income" [rincom98] in the dataset GSS2000R.Sav, is the following statement true, false, or an incorrect application of a statistic? A value of 23, or $110,000 or over, for the variable "income" would position a survey respondent in the top 5% of cases in the data set. • True • True with caution • False • Incorrect application of a statistic This is the general framework for the problems in the homework assignment on percentiles and standard scores. You will be asked whether or not a particular value or score can accurately be characterized as placing a subject in the top 5% or 10% of the cases in the dataset.
Homework problems: Standard Scores - 2 Based on standard scores for the variable "income" [rincom98] in the dataset GSS2000R.Sav, is the following statement true, false, or an incorrect application of a statistic? A value of 23, or $110,000 or over, for the variable "income" would position a survey respondent in the top 5% of cases in the data set. • True • True with caution • False • Incorrect application of a statistic • The first paragraph identifies: • The data set to use, e.g. GSS2000R.Sav • The statistic to use, e.g. percentile or zscore • The variable used in the analysis
Homework problems: Standard Scores - 3 Based on standard scores for the variable "income" [rincom98] in the dataset GSS2000R.Sav, is the following statement true, false, or an incorrect application of a statistic? A value of 23, or $110,000 or over, for the variable "income" would position a survey respondent in the top 5% of cases in the data set. • True • True with caution • False • Incorrect application of a statistic • The second paragraph identifies: • The value of the variable to test • The percentage expected for the value tested
Homework problems: Standard Scores - 4 The answer to a problem will be True if the computed percentile for the tested value supports the finding in the problem statement. The answer to a problem will be True with caution if the computed percentile for the tested value supports the finding in the problem statement, but the variable used is ordinal level. Based on standard scores for the variable "income" [rincom98] in the dataset GSS2000R.Sav, is the following statement true, false, or an incorrect application of a statistic? A value of 23, or $110,000 or over, for the variable "income" would position a survey respondent in the top 5% of cases in the data set. • True • True with caution • False • Incorrect application of a statistic The answer to a problem will be False if the computed percentile for the tested value does not supportthe finding in the problem statement. The answer to a problem will Incorrect application of a statistic if the computed statistic violates the level of measurement requirement, i.e. the variable is not ordinal or interval level or the variable is not normally distributed.
Solving the problem with SPSS:Level of measurement The calculation of standard scores requires that the variable be ordinal or interval level. "Income" is Ordinal, satisfying the requirement. Since not all data analysts agree with the convention of computing z-scores for ordinal variables, a caution will be added to any true findings.
Solving the problem with SPSS: Evaluating normality - 1 Using standard scores to determine the location of a value in the distribution assumes that the distribution of the variable is normal. If the distribution is not normal, we should use percentiles rather than standard scores. We will generate descriptive statistics to evaluate normality at the same time we add zscores to the data set. Select the Descriptive Statistics > Descriptives… command from the Analysis menu.
Solving the problem with SPSS: Evaluating normality - 2 First, move the variable we will use in the analysis, rincom98, to the Variable(s) list box. Second, click on the Options… button to select the statistics we want.
Solving the problem with SPSS: Evaluating normality - 3 First, in addition to the statistics, SPSS has checked by default, mark the Kurtosis and Skewness check boxes on the Distribution panel. Second, click on the Continue button to close the dialog box.
Solving the problem with SPSS: Evaluating normality - 4 Click on the OK button to obtain the output. To add the standard scores, or zscores, for rincom98 to the data set, mark the checkbox, Save standardized values as variables.
Solving the problem with SPSS: Evaluating normality - 5 Obtaining accurate probabilities for standard scores, or zscores, requires that the distribution of the variable satisfy the criteria for a normal distribution. "Income" satisfied the criteria for a normal distribution. The skewness of the distribution (-.686) was between -1.0 and +1.0 and the kurtosis of the distribution (-.253) was between -1.0 and +1.0.
Solving the problem with SPSS: Zscores in the data editor Scroll the data editor window to the right to see the variable SPSS created for the zscores. SPSS’s convention for naming the variable is to prepend the variable name with a “Z”, e.g. Zincom98. We need to identify the zscore associated with a probability of 0.05, or higher (the top 5%). While we could use a table of normal probabilities from a textbook, we will use SPSS to compute the probabilities.
Solving the problem with SPSS:Computing probabilities for zscores - 1 To add the normal distribution probability for each zscore, select Compute… from the Transform menu.
Solving the problem with SPSS:Computing probabilities for zscores - 2 Second, select CDF & Noncentral CDF from the Function group list box. In the Compute Variable dialog, first, type the variable name you want to assign to the zscore probabilities in Target Variable text box. I will use “prob” followed by the name of the zscore variable, e.g. probZrincom98. Third, select Cdfnorm in the Functions list box. Third, move the Cdfnorm to the Numeric Expression: text box using the triangle button. The Cdfnorm function stands for cumulative density function and returns the normal distribution probability for zscores.
Solving the problem with SPSS:Computing probabilities for zscores - 3 When you move the CDFNORM( ) function to the Numeric Expression: text box, SPSS will put a ? Mark in parentheses to indicate that it needs more information, e.g. the name of the variable that it will compute probabilities for. Second, click on the right arrow button to replace the ? Mark with the variable name. First, scroll the list of variables to the bottom and click on the Zrincom98 variable.
Solving the problem with SPSS:Computing probabilities for zscores - 4 CDFNORM(Zrincom98) will calculate the probability from the left tail of the normal distribution up to the z-score value. Since we want the probability above the z-score value, we subtract CDFNORM(Zrincom98) from 1. The 1, or 100%, represents the total probability under the normal curve. The formula for the probabilities is complete. Click on the OK button to close the dialog box.
Solving the problem with SPSS:Sorting the probabilities for zscores - 1 The variable is added to the data set. Our task of evaluating the probability associated with the value stated in the problem will be easier if we sort the data. Right click on the column header for probZrincom98 and select Sort Ascending from the pop-up menu.
Solving the problem with SPSS: Sorting the probabilities for zscores - 2 First, scroll down the values of probZrincom98 to locate the probabilities that are less than or equal to 0.05 (the top 5%). In this example, the zscore of 1.77545 has a probability (.037912) less than .05. Second, click on the row number to highlight the values on the row. This will enable us to see what value for Rincom98 corresponds to this zscore and probability.
Solving the problem with SPSS:Answering the question Scroll the data set to the right until the Rincom98 column is visible. The standard score, or zscore, for the value of 23 on the variable "income" is 1.78. The probability of a zscore of 1.78 is 0.04 (after rounding to 2 decimal places). This probability would position a survey respondent in the top 5% of cases in the data set. The answer to the question is True with caution, since the variable is ordinal.
Removing the standard score variables We do not need the variable that were created to solve the standard score problem, so we will delete them from the data set. First, click on the column headers, Zrincom98 and probZrincom98, to select the variables to delete. Second, select the Clear command from the Edit menu, or press the Delete key on your keyboard.
Logic for percentile problems:Level of measurement and percentile value Measurement level of variable? Interval/ordinal Nominal (dichotomous) Inappropriate application of a statistic Value is in top 5% or 10%? Yes No True False
Logic for standard score problems: Level of measurement and assumption of normality Measurement level of variable? Interval/ordinal Nominal (dichotomous) Skewness and Kurtosis between -1.0 and +1.0? Inappropriate application of a statistic No Inappropriate application of a statistic Yes When the variable is not normally distributed, use percentiles instead of zscores.
Logic for standard score problems:Decision about location of value Value is in top 5% or 10%? Yes No Add caution for ordinal variable. False True