Download
1 / 5
50 likes | 279 Views
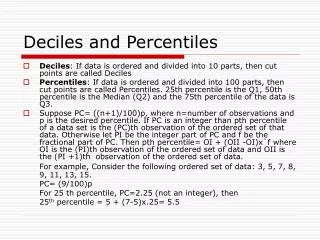
Percentiles. Divide the data into one hundred classes called percentiles. Percentiles. The percentile value is the lowest value that belongs in the class. The percentile indicates the area to the left of the value. Percentiles. Use invnorm (percentile, mean, standard deviation). A problem.

E N D
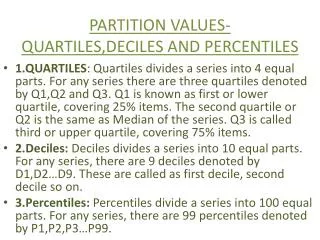
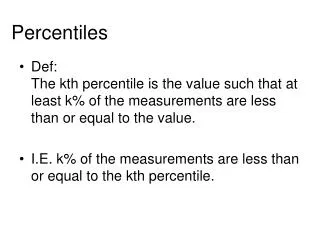
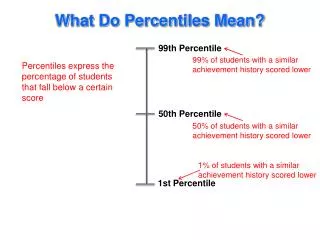
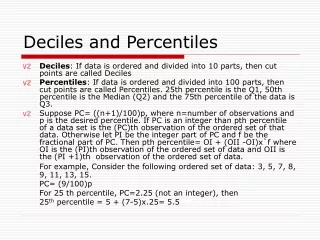
Percentiles Divide the data into one hundred classes called percentiles.
Percentiles • The percentile value is the lowest value that belongs in the class. • The percentile indicates the area to the left of the value.
Percentiles • Use invnorm(percentile, mean, standard deviation)
A problem • For a mean of 250 and a standard deviation of 20 find the percentile value: A) 40 B) 80 C) 90
With words…. • Use a mean of 500 and a standard deviation of 50. • What is the cut off value for the top 10%? • What is the cut off value for the bottom 5%? • Is there an 81st percentile? • What is the interval for the 80th percentile?