Download
1 / 12
130 likes | 353 Views
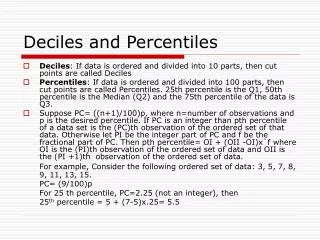
Percentiles. Def: The kth percentile is the value such that at least k% of the measurements are less than or equal to the value. I.E. k% of the measurements are less than or equal to the kth percentile. Calculating Percentiles. A random sample yields the dataset:

E N D
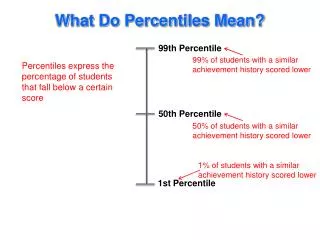
Percentiles • Def:The kth percentile is the value such that at least k% of the measurements are less than or equal to the value. • I.E. k% of the measurements are less than or equal to the kth percentile.
Calculating Percentiles • A random sample yields the dataset: 89 91 50 78 103 99 74 101 81 99 50 90 104 107 114 101 97 113 101 117 • We wish to calculate percentiles and construct a boxplot from this data. • Step 1: Order the data
Order the Data • Order the data from smallest to largest: 89 91 50 78 103 99 74 101 81 99 50 90 104 107 114 101 97 113 101 117 • The data value 90 is what percentile? 50 50 74 78 81 89 90 91 97 99 99 101 101 101 103 104 107 113 114 117
Calculate Percentiles • 2 values are =< 50 • 3 values are =< 74 • 4 values are =< 78 • 5 values are =< 81 • 6 values are =< 89 • 7 values are =< 90 50 50 74 78 81 89 90 91 97 99 99 101 101 101 103 104 107 113 114 117 • 90 is therefore the 100*(7 / 20) = 35th percentile
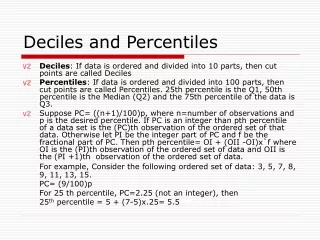
Quartiles • To find quartiles, we first calculate their position in the ordered dataset. • Position of Q1 = .25*(n + 1) .25* (20 + 1) = 5.25 • Position of Q3 = .75* (n + 1) .75* (20 + 1) = 15.75
First Quartile 50 50 74 78 81 89 90 91 97 99 99 101 101 101 103 104 107 113 114 117 • Since 5.25 is not an integer, calculate a value 1/4 of the way between the 5th and 6th numbers. 81 + .25* (89 – 81) = 83 Q1 = 83
First Quartile 50 50 74 78 81 89 90 91 97 99 99 101 101 101 103 104 107 113 114 117 • Since 15.75 is not an integer, calculate a value 3/4 of the way between the 15th and 16th numbers. 103 + .75(104 – 103) = 103.75 Q3 = 103.75
Boxplot • Make an axis for the graph covering the range of the data. 50 50 74 78 81 89 90 91 97 99 99 101 101 101 103 104 107 113 114 117 • Draw bar for the: min, Q1, Median, Q3, and max • Connect edges of bars at quartiles, and middles of min/Q1 and Q3/max
Boxplot • The boxplot is now complete • The plot tells us several things: • Location: the median is at 99 • Spread: the IQR is 20.75 • Shape: This distribution is left-skewed. Note that the left tail is much longer and the median is closer to Q3
Outliers • We will define two more measures: • Lower Fence = Q1 – 1.5*(IQR) = 83 – 1.5*(20.75) = 51.875 • Upper Fence = Q3 + 1.5*(IQR) = 103.75 – 1.5*(20.75) = 134.875 • Any values outside of the fences are suspected to be outliers.
Outliers • We can mark the fences to the boxplot. • Lower Fence = 51.875 , Upper Fence = 134.875 • Any data point outside the fences are marked with * , the ‘whiskers’ extend only to the last data points still inside the fences.
Comments • It may be easier to calculate the fences before constructing the plot. • Boxplots can be vertical. • Boxplots using * for outliers are sometimes called modified boxplots. • Sometimes “Outer Fences” are used to denote “extreme outliers”, calculated by: Q1 – 3*(IQR) Q3 + 3*(IQR)