Download
1 / 25
250 likes | 373 Views
W. S. Olson (with lots of help from TRMM Latent Heating study group, etc.). Latent Heating Estimates from TRMM. • TRMM satellite observations • What is it we’re really trying to estimate? • Principles behind heating estimation • Evaluation of estimates

E N D
W. S. Olson (with lots of help from TRMM Latent Heating study group, etc.) Latent Heating Estimates from TRMM • TRMM satellite observations • What is it we’re really trying to estimate? • Principles behind heating estimation • Evaluation of estimates • Applications to intraseasonal variability • Outlook
TMI PR TRMM Precipitation Sensors 1997 - 2011/2013 PR (precipitation radar; 13.8 GHz) TMI (microwave imager; 10 - 85 GHz) • more detailed vertical structure from PR. • sampling by TMI ~1 day-1 vs. ~0.3 day-1 for PR of 1o box at the equator. images, courtesy Hal Pierce
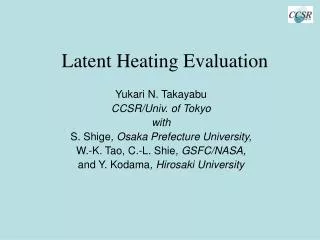
Mean Heating Profiles from Long-Term Simulation QR Latent Q1 Eddy 500 km GCE Model radiative heating eddy sensible heat flux convergence phase change or “latent heating” What is it we’re really trying to estimate? from Wei-Kuo Tao Generally, we estimate Latent Heating or Q1 - QR ....
convective stratiform convective stratiform ensemble-mean profiles from cloud-resolving model simulations: Mean Stratiform Mean Convective Categorization of Precipitation/Heating Profiles “Unknown” Latent Heating “PR Observed” Reflectivity Altitude [km] Altitude [km] Distance [km] Distance [km]
echo top convective stratiform convective stratiform Mean Stratiform Heating Profiles Mean Convective Heating Profiles Categorization of Precipitation/Heating Profiles “Unknown” Latent Heating “PR Observed” Reflectivity Reflectivity Latent Heating Altitude [km] Altitude [km] Distance [km] Distance [km] ensemble-mean profiles from cloud-resolving model simulations: from Shoichi Shige
<LHconv(z)> <LHstrat(z)> LHtot(z) = Lv Pconv + Lv Pstrat < Lv Pconv> <Lv Pstrat> observed observed from CRM model convective area from CRM model stratiform area Example: Convective/Stratiform Heating (CSH) Algorithm Tao and Lang • observePconvand Pstrat . • select precipitation-normalized heating profiles from tables. • rescale normalized profiles by observed precipitation rates (“condensate balance” under steady-state conditions). convective stratiform LHstrat LHconv layer Pstrat Pconv from radar:
<LHconv(z)> <LHstrat(z)> LHtot(z) = Lv Pconv + Lv Pstrat < Lv Pconv> <Lv Pstrat> observed observed from CRM model convective area from CRM model stratiform area Example: Convective/Stratiform Heating (CSH) Algorithm • observePconvand Pstrat . • select precipitation-normalized heating profiles from tables. • rescale normalized profiles by observed precipitation rates (“condensate balance” under steady-state conditions). convective stratiform layer LHstrat LHconv Psmelt Pcmelt layer Pstrat Pconv
<LHconv(z)> <LHstrat(z)> LHtot(z) = Lv Pconv + Lv Pstrat < Lv Pconv> <Lv Pstrat> observed observed from CRM model convective area from CRM model stratiform area Example: Convective/Stratiform Heating (CSH) Algorithm • observePconvand Pstrat . • select precipitation-normalized heating profiles from tables. • rescale normalized profiles by observed precipitation rates (“condensate balance” under steady-state conditions). layer convective stratiform layer LHstrat LHconv layer layer layer layer Pstrat Pconv
NameModel Heating ProfilesInput Observations Convective/Stratiform composite convective surface convective & Heating (CSH; Tao, Lang) and stratiform profiles stratiform precip rates Spectral Latent composite convective surface and melting Heating (SLH; Shige, of different depths; composite level convective & Takayabu) stratiform with different stratiform precip rates melting layer precip rates Hydrometeor Heating ~none full precip profiles Algorithm (HH; Tao, Yang, Smith) Precipitation Radar ~none full precip profiles Heating (PRH; Satoh, (+moisture budget) Katsumata) --------------------------------------------------------------------------------------------------------------------------------------------- “Trained” Radiometer SLH-like estimates of TMI radiances; Heating Algorithm heating used to train climatological SST’s (TRAIN; Grecu, Olson) TRMM Microwave Imager algorithm (Bayesian framework) Methods Usually PR-driven: Specifically TMI-driven:
Evaluation of Estimates • comparisons to (limited) independent ground truth. • algorithm intercomparisons. • sampling errors.
SCSMEX LBA KWAJEX NESA SESA Comparisons to Independent Observations Field Campaigns in the TRMM Observing Area
SCSMEX NESA Rawinsonde Q1 KWAJEX Rawinsonde Q1 LBA Rawinsonde Q1 Comparisons to Independent Observations Average Rawinsonde Q1 SCSMEX LBA KWAJEX • fairly distinct Q1 time series and mean profiles. • use rawinsonde budget estimates of Q1 to evaluate TRMM satellite estimates. from Zhang, Johnson, Schumacher
SCSMEX NESA SESA Comparisons to Independent Observations • add radiative heating (QR) from Tristan L’Ecuyer to Q1-QR from TRAIN algorithm. • compare resulting Q1 to rawinsonde Q1. • some differences due to limited sampling by TMI (~ 1.3 day-1). rawinsonde from Johnson and Ciesielski (2002)
Convective/Stratiform Partitioning of Profiles Average Heating Profiles over NESA [oK day-1] rawinsonde (Q1) CSH (Q1-QR)* SLH (Q1-QR) HH (LH) PRH (LH) GPROF (Q1-QR) CSU (QR) GPROF (Q1) rawinsonde (Q1) SLH (LH) SLHC (Q1-QR) SLHS (Q1-QR) PRHC (LH) PRHS (LH) SLHC (LH) SLHS (LH) GPROFC (Q1-QR) GPROFS (Q1-QR) TRAIN TRAIN TRAIN TRAIN ALTITUDE [km] ALTITUDE [km] Average Heating Profiles (ºC day-1) HEATING RATE [oK day-1] HEATING RATE [oK day-1] courtesy Steve Lang Intercomparison Results for SCSMEX NESA • adding QR to “most” satellite heating estimates results in Q1 magnitudes close to rawinsonde budget diagnostic. • differences in in altitude of maximum heating are linked to differences in stratiform heating profiles. rawin ~ 0.3 km
Temporal Sampling Errors for Rain Estimates (~ Integrated Heating) TMI 10o x 10 days TMI 5o x 5 days • Tom Bell’s very quick and dirty analysis of temporal sampling error for TMI. • see temporal sampling errors, even for heavier rains, are substantial. • PR sampling error almost 2 x TMI error.
Applications • intraseasonal studies.
MJO Composites from the Precipitation Radar from Morita et al. (2006) OLR, PS, Pc Anomaly Structure Latent Heating Anomaly Structure (SLH) OLR Stratiform Rain Convective Rain • composites based upon 3.5 years of PR observations in the 10oS - 10oN equatorial band; OLR anomaly minima between 60oE and 150oE. • stratiform rain anomaly lags convective rain anomaly slightly; stratiform proportion increases with total rain. • heating composite anomaly (from SLH algorithm) shows top-heavy structure at peak of active phase; trailing stratiform heating; ~ Lin et al. (2004); Kiladis et al. (2005).
TMI Q1 - QR + TMI/VIRS QR = Q1 TMI Q1 - QR (TRAIN Algorithm) TMI/VIRS QR (Tristan L’Ecuyer) K day-1 1 Oct 1998 1 Oct 1998 1 Oct 1998 1 Apr 1999 1 Apr 1999 1 Apr 1999 ECMWF Model-Based Analysis Q1 TMI Q1 - QR + TMI/VIRS QR = Q1 ECMWF Model-Based Analysis Q1 Percentage Stratiform Rainfall TMI PR ECMWF Surface Rain Rate TMI Calibrated IR (3B42) ECMWF Model Time Series of Heating and Stratiform Rain Percentage in the Box 10oS - 10oN, 70oE - 90oE from 10/98 - 3/99. Intraseasonal Variability from TRMM Microwave Imager from Xianan Jiang Equatorial (10 oS - 10 oN) 10/98 - 3/99 Mean Heating and Rain Rates 100 hPa PRESSURE 950 hPa PRESSURE PRESSURE mm day-1 LONGITUDE
Outlook: • Latent heating algorithms are still maturing; estimates should be used with caution! • No single algorithm stands out as consistently better in comparisons to ground-based observations. • Proper characterization of bias in estimates will require more independent ground-based heating estimates. • Temporal sampling errors may eventually be mitigated by multiple-radiometer applications. • Improvements in cloud resolving model simulations (i.e., bias reduction) will generally lead to significant improvement in satellite heating estimates.
Latent Heating Products: • CSH estimates at monthly, 0.5o resolution on GSFC DAAC; daily, 0.25o estimates being produced. • SLH estimates at different resolutions may be obtained from JAXA/Earth Observation Research Center website in ~Dec./Jan. timeframe. • TRAIN estimates at daily, 0.5o resolution will likely become available from the NEWS Data and Information Center (NDIC) within ~6 mon.
PRECIP FLUX IN layer ALTITUDE PRECIP FLUX OUT PRECIPITATION WATER CONTENT LAYER-INTEGRATED HEATING RATE = LS X (PRECIP FLUX OUT - PRECIP FLUX IN) How do we infer heating magnitude? (assumes steady state; i.e., average fluxes over many profiles)
Mean SLH Profiles SLH Reconstructed Heating Time Series Mean GCE Profiles GCE Model Latent Heating Time Series from Shige et al. JAM (2004) Synthetic Data Tests • GCE model is forced with TOGA COARE sounding data (19-26 Dec. 1992). • SLH algorithm is applied to GCE-simulated reflectivity data.
from Shige et al. (2007) Monthly mean Q1-QR profiles over the Pacific Ocean derived from SLH: El Nino vs. La Nina Feb ‘98 El Nino Feb ‘98 El Nino Western Pacific Central Pacific Eastern Pacific Feb’ 99 La Nina Feb ‘99 La Nina Eastern Pacific Western Pacific Central Pacific
Monthly mean Q2 profiles over the Pacific Ocean derived from SLH: El Nino vs. La Nina from Shoichi Shige Feb ‘98 El Nino Feb ‘98 El Nino Western Pacific Central Pacific Eastern Pacific Feb’ 99 La Nina Feb ‘99 La Nina Eastern Pacific Western Pacific Central Pacific