Download
1 / 18
200 likes | 490 Views
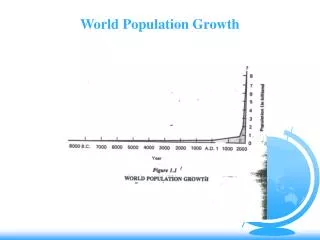
World Population Growth Through History. Billions. 12. 11. 2100. 10. 9. Modern. Age. Old. 8. Iron. Middle. Bronze. Stone. Age. New Stone Age. Ages. Age. Age. 7. Future. 6. 2000. 5. 4. 1975. 3. 1950. 2. 1900. 1. 1800. Black Death. —. The Plague. 2000.

E N D
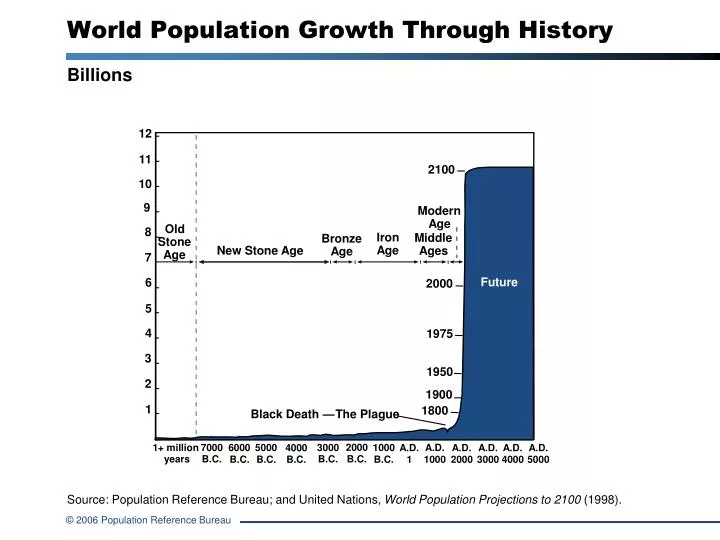
World Population Growth Through History Billions 12 11 2100 10 9 Modern Age Old 8 Iron Middle Bronze Stone Age New Stone Age Ages Age Age 7 Future 6 2000 5 4 1975 3 1950 2 1900 1 1800 Black Death — The Plague 2000 1+ million 7000 6000 5000 3000 1000 A.D. 4000 A.D. A.D. A.D. A.D. A.D. years B.C. B.C. B.C. B.C. B.C. B.C. B.C. 1 1000 2000 3000 4000 5000 Source: Population Reference Bureau; and United Nations, World Population Projections to 2100 (1998).
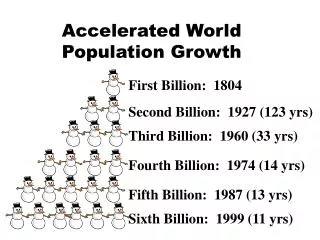
World Population Growth, in Billions Number of years to add each billion (year) All of Human History (1800) 130 (1930) 30 (1960) 15 (1975) 12 (1987) 12 (1999) 14 (2013) 14 (2027) 21 (2048) Sources: First and second billion: Population Reference Bureau. Third through ninth billion: United Nations, World Population Prospects: The 2004 Revision (medium scenario), 2005.
Growth in More, Less Developed Countries Billions Less Developed Regions More Developed Regions Source: United Nations, World Population Prospects: The 2004 Revision (medium scenario), 2005.
World Population Clock 2005 Source: Population Reference Bureau, 2005 World Population Data Sheet.
Projected Population Change, by Country Percent Population Change, 2005-2050 Source: Population Reference Bureau, 2005 World Population Data Sheet.
The Classic Stages of Demographic Transition Note: Natural increase is produced from the excess of births over deaths.
Birth and Death Rates, Worldwide Rates of birth, death, and natural increase per 1,000 population Natural Increase Source: United Nations, World Population Prospects: The 2004 Revision, 2005.
10 Places With the Lowest Total Fertility Worldwide Average number of children per woman, 2000-2005 Source: United Nations, World Population Prospects: The 2004 Revision, 2005.
Women of Childbearing Age Number of Women 15 to 49 Billions Source: United Nations, World Population Prospects: The 2004 Revision (medium scenario), 2005.
Diverging Trends in Fertility Reduction Average number of children per woman Source: United Nations, World Population Prospects: The 2004 Revision, 2005.
Trends in Life Expectancy, by Region Life Expectancy at Birth, in Years Source: United Nations, World Population Prospects: The 2004 Revision (medium scenario), 2005.
Trends in Urbanization, by Region Urban Population Percent Source: United Nations, World Urbanization Prospects: The 2003 Revision (medium scenario), 2004.
Largest Cities, Worldwide Millions 1950 2000 2015 Source: United Nations, World Urbanization Prospects: The 2003 Revision (medium scenario), 2004.
Urbanization in Central America Population Living in Urban Areas Percent Source: United Nations, World Urbanization Prospects: The 2003 Revision (medium scenario), 2004.
Age Distribution of the World’s Population Population Structures by Age and Sex, 2005 Millions Less Developed Regions More Developed Regions Age 80+ 75-79 70-74 65-69 60-64 55-59 50-54 45-49 40-44 35-39 30-34 25-29 20-24 15-19 10-14 5-9 0-4 Male Female Male Female Source: United Nations, World Population Prospects: The 2004 Revision, 2005.
Trends in Aging, by World Region Population Ages 65 and Older Percent Source: United Nations, World Population Prospects: The 2004 Revision (medium scenario), 2005.
Women and Aging Projected World Population, by Sex, at Specified Age Groups, 2025 Percent Source: United Nations, World Population Prospects:The 2004 Revision (medium scenario), 2005.
Adult Literacy, by Region Literacy Rates, by Sex, 2000-2004 Percent Source: UNESCO Institute for Statistics: accessed online at www.uis.unesco.org/TEMPLATE/html/Exceltables/education/Literacy_Regional_April2006.xls on May 21, 2006.