Download
1 / 35
350 likes | 400 Views
What affects population size?. Population growth. Starting activity: Come up with a definition for the following Population Population size Population density. Lesson objectives:. Pupils will be able to.....

E N D
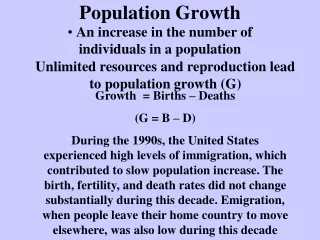
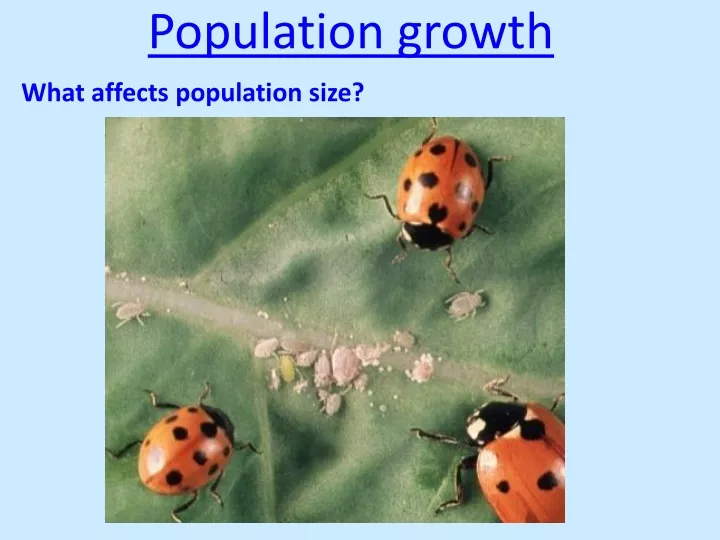
What affects population size? Population growth
Starting activity: Come up with a definition for the following • Population • Population size • Population density
Lesson objectives: Pupils will be able to..... • Explain the significance of limiting factors in determining the final size of a population; • Explain the meaning of the term carrying capacity; • Explain, with examples, the terms interspecific and intraspecific competition;
Population growth Algal cell capable of asexual reproduction • List as many reasons as you can as to why its population would stop growing? Very hard to investigate in a natural open environment like a pond....so we don’t! In a lab, bacteria can be grown in a nutrient medium kept under constant conditions.
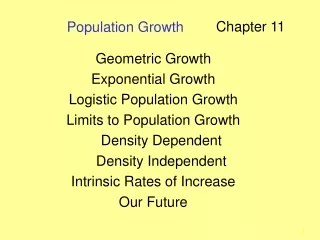
r/K selection theory of population growth Selective pressures drive evolution in one of two generalized directions: Either r- or K-selection. r refers to reproductive rate K refers to a constant
Logistic growth curve (k-Strategists) Carrying capacity
Boom and bust (r-Strategists) K Carrying capacity ‘Bust’ ‘Boom’ Population size Time
r-strategists examples • Typically, r-selected species exploit less-crowded ecological niches, and produce many offspring, each of which has a relatively low probability of surviving to adulthood. • Organisms with r-selected traits range from; • Bacteria. • Diatoms. • Micro fungi (Penicillium, Yeast). • Insects. • Weeds. • Various cephalopods e.g. Squid. • Some mammals, especially small rodents.
r- and K-strategistsIn ecological succession • r- strategists prosper at first, as the environment is unstable, however, as species settle the environment begins to become more stable and K- strategists take control.
r- and K-strategistsIn ecological succession • In areas of major ecological disruption or sterilisation (such as after a major volcanic eruption, as at Krakatoa or Mount Saint Helens), r- and K-strategists play distinct roles in the ecological succession that regenerates the ecosystem. • Because of their higher reproductive rates and ecological opportunism, primary colonisers typically are r-strategists and they are followed by a succession of increasingly competitive flora and fauna.
r- and K-strategistsIn ecological succession • Eventually a new equilibrium is approached (sometimes referred to as a climax community), with r-strategists gradually being replaced by K-strategists which are more competitive and better adapted to the emerging micro-environmental characteristics of the landscape.
Human Population Growth • Are humans r- or K-strategists? Why? • Where is the human population on its typical growth curve? • Is there any reason to believe that we will not experience the “standard” pattern?
Limiting factors and carrying capacity • Limiting factors are collectively called Environmental resistance • Carrying capacity = maximum population size that can be maintained over a period of time in a particular habitat and resources available Limiting factors Density dependent (biotic) Density independent (abiotic)
Limiting factors affect population by influencing ........What factors? • Birth rate (natality) • Death rate (mortality) • Immigration • Emigration
What will influence the carrying capacity? Make a table and list as many factors as you can that would... • Increase the carrying capacity • Decrease the carrying capacity Discuss your ideas with your neighbour!
Checking understanding... • Explain the connection between carrying capacity and limiting factors Homework:
B C D A
What’s the difference.... • Intraspecific competition • Interspecific competition Give some examples of each.
Inter-specific competition Example 1 - Paramecium P.caudatum P.aurelia
Interspecific competition & competitive exclusion principle 1934, Russian Biologist Carl Fredrick Gausse Competitive exclusion principle: no two species can occupy the same niche indefinitely when resources are limiting.
Inter-specific competition affects: 1.Size of two populations • When grown separately, populations of P. caudatum and P.bursaria are three times denser than when grown together
2. Distribution of two populations • P. caudatum survived towards top of tube - better adapted to feed on bacteria - more oxygen at top so more bacteria • P.bursaria survived towards bottom of tube - better adapted to feed on yeast - less oxygen = bacterial growth not favoured, more yeast survive
Cormorant- Phalacrocorax carbo Shag - Phalacrocorax aristotelis • Mixed diet, sand eels and herring • Fishes in shallow estuaries • Nests low on cliffs or shallow ledges • Eats mostly flat fish, gobies and shrimps • Fishes out to sea • Nests on high cliffs or broad ledges
Shag Cormorant
Extinction of one population is not necessarily inevitable... • Interspecific competition could result in two populations, one being much smaller than the other, both remaining constant. • Other variables will take effect, environmental factors, for example.
Population distribution What can you explain from this diagram?
Acorn barnacle - Chthamalus • Able to live both low down and high up on shore • Smaller in size
Crenate barnacle - Balanus • Only survives lower down shore as not well adapted to tolerate exposure to air at low tide • Larger in size
Tasks: • Complete worksheet on barnacles. • Complete question sheet on competition • Complete competition exam question (Jan 05 Q4) Finish all above tasks for homework