Download
1 / 12
180 likes | 491 Views
AIMS: 1. To calculate Population Momentum and consider its impacts. 2. To critique Choropleth maps. Population Momentum and World Population Growth. As we have seen, global fertility is declining. HOWEVER, before the rate of natural increase declines, there is a lag period.

E N D
AIMS: 1. To calculate Population Momentum and consider its impacts.2. To critique Choropleth maps.
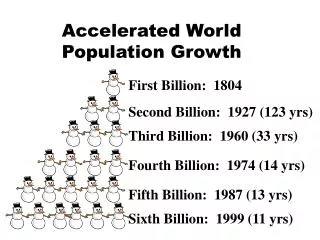
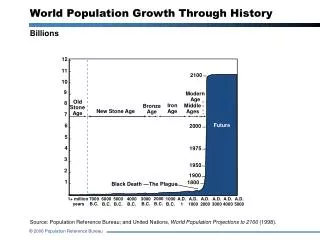
Population Momentum and World Population Growth As we have seen, global fertility is declining. HOWEVER, before the rate of natural increase declines, there is a lag period. This is because children and youths who have already been born have not yet met their childbearing years. The population has momentum to keep growing. POPULATION MOMENTUM is when popn continues to grow even after the replacement level of fertility has been met. High percentage of popn at or before childbearing age.
Average Life Expectancy at Birth Crude Birth Rate X Population Momentum Factor (PMF)
PMF >1 There is positive momentum in the population which will lead to further growth. Natural increase is not contributing to population growth. The is negative momentum, with a high probability that the population will decline in size. 1 <1
Accounting for PMF NIGERIA 0.043 X 47 = 2.021 This is fairly typical for African nations (short life expectancies but continued growth because of high fertility). VIETNAM 0.017 X 73 = 1.241 Vietnam has seen rapid economic development since 1990. Large decline in popn fertility (popn continues to grow because of increase in life expectancy- better living standards). JAPAN 0.009 X 82 = 0.738 Declining popn (decreasing BR and increasing LE). Large elderly popn supported through income taxes. Choose 3 countries and calculate their PMF. Try to choose 3 that will contrast nicely.
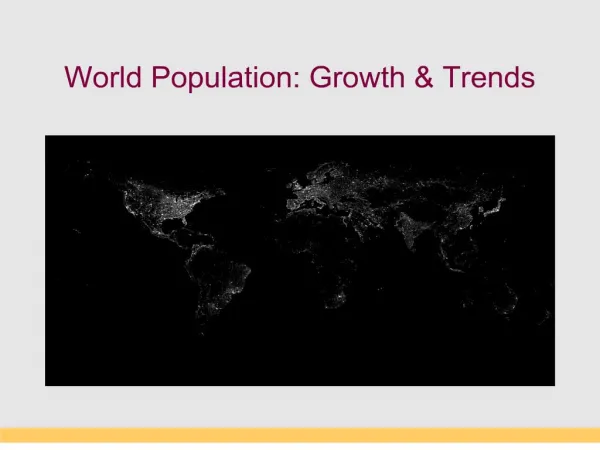
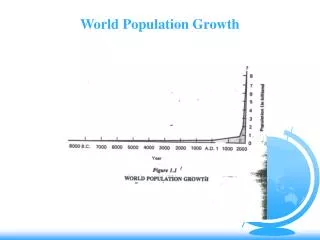
AS WORLD POPULATION GROWTH SLOWS, THIS DOES NOT MEAN THAT WORLD POPULATION WILL DECLINE, MERELY THAT IT WILL GROW AT A SLOWING RATE OF INCREASE. Growth is getting smaller, not population size.
Global Population Density (persons per square kilometre) China: Eastern half of the country Egypt: along the Nile River valley Australia: concentrated along the South-East coast
What are some of the problems associated with using Choropleth Maps?
VERY COLD DESERT 80% popn MOUNTAINOUS