Download
1 / 17
180 likes | 347 Views
Kenlo Nishida Institute of Agricultural and Forest Engineering, University of Tsukuba kenlo@sakura.cc.tsukuba.ac.jp.

E N D
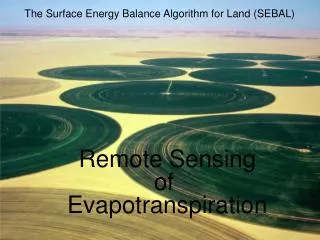
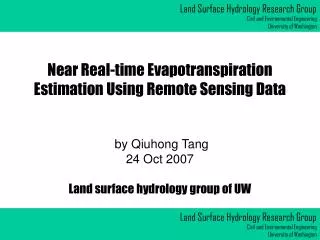
Kenlo Nishida Institute of Agricultural and Forest Engineering, University of Tsukuba kenlo@sakura.cc.tsukuba.ac.jp Evapotranspiration (ET) from land in the eastern Asia was estimated with satellite remote sensing. The algorithm is a simple two-source model consisting of ET from bare land and ET from vegetation. ET from vegetation was estimated by combination of Penman-Monteith equation and the complementary relationship (relationship between actual evaporation and potential evaporation of Penman and Proestley-Taylor). ET from bare land was estimated by VI-Ts diagram. By applying this method to NOAA/AVHRR and Terra/MODIS sensors, distribution of evaporation fraction was mapped in a regional scale. JWH02/04P/D-002 1400-027 Poster IUGG 2003, July 4, Sapporo Evapotranspiration on Terrestrial Eastern Asia Estimated by Satellite Remote Sensing
MOD16 Evapotranspiration Project • MOD16 is a project for operational estimation of terrestrial evapotranspiration (ET) by a satellite sensor (Aqua/MODIS) • MOD16 algorithm is applicable not only for Aqua/MODIS but also for Terra/MODIS, ADEOS2/GLI, and NOAA/AVHRR etc. • Currently, the algorithm has been established. (Nishida et al., 2003) • Tests have been done mainly on North America. • In this study, we test MOD16 logic with NOAA/AVHRR data for Eastern Asia. • Nishida, K., Nemani, R. R., Running, S. W., Glassy, J. M. (2003): An operational remote sensing algorithm of land surface evaporation. Journal of Geophysical Research D, in press • Nishida, K., Nemani, R. R., Running, S. W., Glassy, J. M. (2003): Development of an evapotranspiration index from Aqua/MODIS for monitoring surface moisture status. IEEE Transactions of Geoscience and Remote Sensing, 41(2), 493-501.
MOD16 ET Logic (1): Conceptual Frame Actual landscape: mixture of forest, farm, grassland, road, etc. Simplification (Two-source model) ETbare ETveg ET = fveg ETveg + (1 - fveg) ET soil Qveg Qbare EF = fveg------- EFveg + (1 -fveg) ------ EFbare QQ Available Energy Fraction of bare soil: 1.0 - fveg Net radiation (radiation absorbed on the land) Ground heat transfer Fraction of vegetation: fveg
MOD16 ET Logic (2): EstimatingEFveg Assuming complementary relationship (ET + PETPM = 2PETPT; PETPM=Penman’s PET; PETPT=Priestley-Taylor’s PET), we can get: Constant. 1.26 Derivative of saturated vapor pressure curve (change with T) αΔ EFveg = ------------------------------------Δ + γ ( 1 + rc / 2 ra) Psychrometric constant (slightly change with T) Aerodynamic resistance Canopy resistance 1 / rc = f1(T) f2(VPD) f3(PAR) f4()/ rcMIN Temperature Solar radiation Humidity Soil water Change of VI Implementation 1 / rc = f1(T) f3(PAR) / rcMIN
MOD16 ET Logic (3): EstimatingEFbare satellite image Ts Tbare max Warm Edge Wind speed Tbare Window Tbare max – Tbare EFbare= ---------------------- Tbare max – Tbare min Tveg=Tbare min Air temperature VI VImin VImax VI VI-Ts diagram (Nemani & Running, 1989; 1993) Qbare0– ET Tbare = ------------------------------------ + Ta 4εσTa3 (1- CG) + Cp/ra bare
MOD16 ET Logic (4): Data Stream Satellite data VI albedo Channel reflectance Thermal IR Ts Tbare max Tbare Ta VI Ts VI-Ts diagram EFbare VI fveg OrbitTa Rd PAR Radiative transfer model RdTaalbedo Qbare Qbare0 Qveg Radiation budget EF Qbare Tbare max Ta U50m ra Energy budget Ta PAR Conductance model rc Ta ra rc Penman-Monteith & Complementary relation EFveg
Test in USA Nishida et al., 2003, JGR Comparison of estimated EF by AVHRR and observed EF at AmeriFlux sites -------------------------------------------------------------------------------------------------------------------------------------- site (symbol) type data size R 2 bias standard error -------------------------------------------------------------------------------------------------------------------------------------- Harvard Forest DBF 28 0.75 -0.05 0.13 Walker Branch DBF 29 0.88 0.01 0.13 Willow Creek DBF 8 0.80 -0.14 0.18 WLEF Tower DBF 17 0.89 -0.18 0.20 Blodgett ENF 11 0.30 -0.12 0.21 Duke Forest ENF 13 0.70 0.04 0.19 Howland ENF 20 0.84 -0.02 0.10 Metolius ENF 15 0.20 -0.12 0.23 Bondville Crop 37 0.81 -0.07 0.19 Ponca Crop 6 0.36 -0.10 0.31 Little Washita Grass 20 0.86 0.04 0.14 Shidler Grass 10 0.91 -0.03 0.12 Ski Oaks Shrub 16 0.29 -0.07 0.17 all sites --- 230 0.74 -0.05 0.17 --------------------------------------------------------------------------------------------------------------------------------------
Test in Eastern Asia • Data • NOAA/AVHRR 1km-10day composite, 1999, by Iwate University(Yokoyama, Lei, and Purevdorj, 2002) • Land Cover Dataset, Asian Association on Remote Sensing (AARS)0.5minute grid
1999/02 1999/01 EFv EF EF EFv EFb fv EFb fv 1999/03 1999/04 EFv EF EFv EF fv EFb fv EFb
1999/06 1999/05 EFv EF EF EFv EFb fv EFb fv 1999/08 1999/07 EF EFv EFv EF fv fv EFb EFb
1999/10 1999/09 EFv EF EFv EF fv EFb EFb fv 1999/11 1999/12 EFv EF EFv EF fv EFb EFb fv
Validation at Takayama Flux Site Courtesy for field data: Dr. Saigusa, AIST
Validation at EGAT Tower Courtesy for field data: Dr. Toda, Hokkaido Univ.
Evaluation of Water Budget (vertical only) Gain: precipitationGPCC, global, monthly, 1deg Loss: evapotranspirationEF * (Rn-G) Rn: NCEP reanalysis G: Moran, 1989G=0.58 exp(-2.13NDVI) Gain – Loss = Budget
1999/01 1999/02 1999/03 1999/04 1999/05 1999/06 1999/07 1999/08 1999/09 1999/10 1999/11 1999/12 mm/month
Conclusion • MOD16 logic was tested in Eastern Asia, 1999, with NOAA/AVHRR composite. • Validation with ground observation data from two sites showed consistent accuracy with North America. • In combination of radiation and precipitation data, MOD16 EF product provides vertical water budget, which has implication on water resource monitoring. Acknowledgements: Dr. Liping Lei in Basic Engineering Co., Ltd. allowed me to use AVHRR composite dataset. Mr. W. Takeuchi in the University of Tokyo arranged the AVHRR datasets. Dr. N. Saigusa in AIST provided me with energy flux data taken in Takayama flux site. Drs. M. Toda and N. Ohte carried out the energy flux observation in EGAT Tower site with a support from GAME(GEWEX Asian Monsoon Experiment)-Tropics. The MOD16 algorithm development was supported by JSPS Fellowship for Study Abroad as well as NASA and Numerical Terradinamic Simulation Group (NTSG) of University of Montana.