Download
1 / 31
310 likes | 502 Views
Collaborative Systemwide Monitoring and Evaluation Project (CSMEP) Presentation to PNAMP Steering Committee August 28, 2008. CBFWA ESSA Technologies Ltd. Tribal Agencies CRITFC Nez Perce Tribe Colville Tribes Yakama Nation Umatilla Tribes Consultants

E N D
Collaborative Systemwide Monitoring and Evaluation Project (CSMEP) Presentation to PNAMP Steering Committee August 28, 2008
CBFWA ESSA Technologies Ltd. Tribal Agencies CRITFC Nez Perce Tribe Colville Tribes Yakama Nation Umatilla Tribes Consultants Eco Logical ResearchQuantitative Consultants PER WEST State Agencies IDFG ODFW WDFW Federal Agencies NOAA USFWSEPA DFO CSMEP Analyses - Tools
Status and Trends abundance productivity (age structure) spatial structure spatial diversity population, MPG, ESU scales PIT Tags PIT Tags Harvest Hatchery Hatchery: Wild (straying) relative productivity Hatchery: Wild Age structure ESU scales • redd counts • weirs • carcasses • MRC • juvenile traps • other methods program, population, system scales • onboard monitoring • landed catch monitoring • creel surveys PIT Tags PIT Tags Habitat Hydrosystem abundance productivity spatial structure spatial diversity watershed, population, scales • upstream/downstream • estimate • estimate of total survival • mainstem survival • SARS population, MPG, ESU, system scales PIT Tags • dam monitoring
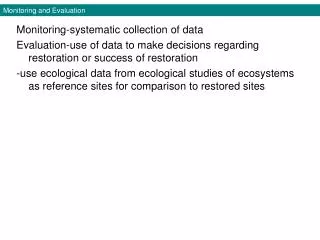
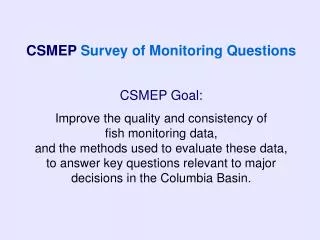
Status and Trends M&E Purpose: Assess viability of the population and evaluate overall management strategies. Status and Trends will tell you what the population is doing but not why.
CSMEP Analyses/Tools SOTR Reporting 1) Monitoring Data S&W Assessments (S&T) CSMEP Analyses/Tools 2) Salmon Viability Model 3) Integrated Costs Database Tool Project Specific Planning/Budgeting
Status & Trends Monitoring Priority Question: Are salmon viable using IC-TRT criteria? Related Decision: Has there been sufficient improvement in the status of a salmon population/ESU to justify delisting and allow removal of ESArestrictions?
What if we make the wrong decision? De-listing when not warranted Risk to populations Not de-listing when warranted • Missed fishing opportunities • Lost land use opportunities • Unjustified cost of ESA protections
How likely to make the correct viability decision with different levels of monitoring intensity? Data Needs: • Abundance • Productivity • Spatial structure • Diversity Viability Status: • Not Viable • Maintained • Viable • Highly Viable Technical Recovery Team viability criteria Objective: Create a tool to help managers evaluate alternative monitoring designs Approach: Evaluate existing monitoring data and develop a model to explore the ability of monitoring to correctly assess salmon population viability
Salmon Viability Simulation Model(CSMEP S&T group, D. Pickard, C. Jordan, C. McGrath) 1st step towards model: try to quantify variability/uncertainty in the quality of monitoring data: • CSMEP S&W assessments • Summary of the statistical properties of different methods for estimating fish performance measures. D. Pickard - ESSA Report • Current research on sampling variability by Dan Rawding (WDFW) and Claire McGrath (USFS)
Monitoring activities used to assess viability x = monitoring occurs in at least one Major or Minor Spawning Area; a = PIT-tags scanned at weirs; b = CWT recoveries of hatchery adults at hatchery weirs.
Summaries of the quality of Status Quo Monitoring (feeding the viability model)
Alternative designs to explore within viability model(example – a ‘Medium” design)
Model Inputs & Outputs TRUTH (A, P, SS, D) Model inputs Abundance (CV and bias) Model outputs Age-structure (smoothing) Probability of correctly assessing viability Strengths & weakness assessments Model Spatial coverage Diversity
Model Inputs: Spatial Structure & Diversity • A probability transition matrix is used to determine the probability of correctly classifying the data in each of the 4 risk categories (H, M, L, VL) given the monitoring in place
Model Input: Abundance & Productivity Abundance Productivity
The monitoring design defines the assumed measurement error (“noise’) e.g., Unbiased, low precision e.g., Unbiased, medium precision e.g., Biased, medium precision
Measurement error within the model: • Derived from CSMEP’s S&W assessments and user inputs • Dependent on level of effort to assess spawners • Bias depends on how spatially representative the sampling • Dependent on quality of information from each identified spawning area • Dependent on the number of samples obtained • Dependent on variable ability to ‘get hands on fish’
32 populations 5 major population groups (MPGs) Diversity of current monitoring efforts State biologists are interested in modifying monitoring designs Objective: Test the ability of alternative monitoring designs to correctly assess viability Test case: Snake Basin Spring/Summer Chinook Evolutionarily Significant Unit (ESU)
Pr (correct assessments) A single run of the simulation Low 0.41 Status quo 0.60 Medium 0.73 High 0.84
Utility of Salmon Viability Model • Given that we have: • A framework for decision making • Estimates of uncertainty in data • The simulation modeling allows us to: • Evaluate sensitivity of decisions to quality of monitoring data • Test influence of specific types of monitoring data on decisions • Managers to evaluate alternative monitoring designs • Viability model is currently coded in R; now converting to more user friendly format and developing associated user guide to allow managers to explore their own alternative M&E designs
Integrated Costs Database Tool(CSMEP S&T group, D. Carr - programmer) • A relational database (MS Access) developed to allow estimation of the cost of integrated monitoring designs • Combines the costs of equipment, manpower, tagging and analyses required for a suite of survey techniques required across S&T and 4H monitoring • Also helps identify the particular performance measures that could be captured within a proposed monitoring design
Interaction of viability and cost estimates 1.0 probability Probability of correct viability decision 0.5 0.0 Monitoring Cost ($) Yes - Stop Have we achieved acceptable reliability at acceptable cost? No - Redesign
Objectives by Alternatives Matrix:Status & Trends Designs Design Design Performance Measures Performance Measures Design examples Design alternatives Objectives Objectives (Abundance and Spatial (Abundance and Spatial Status Status Low Low Med Med High High Structure) Structure) Quo Quo Inferential Inferential ability to make viability ability to make viability Very Good ability ability assessments for each population assessments for each population Excellent Fair Poor Poor Poor Fair Good (Qualitative) (Qualitative) in the ESU in the Snake Sp/S Chinook ESU 1,170 1,283 175 175 710 710 2,100 2,125 Cost ($) Cost ($) annual cost of design alternatives annual cost of design alternatives (x $1,000) (x $1,000) .55 0.60 0.41 .45 .87 0.73 .94 0.84 Statistical Statistical Pr (making the correct viability Pr (making the correct viability Reliability Reliability assessment for Snake ESU) assessment for ESU populations) Status and Trends Subgroup