Download
1 / 32
320 likes | 477 Views
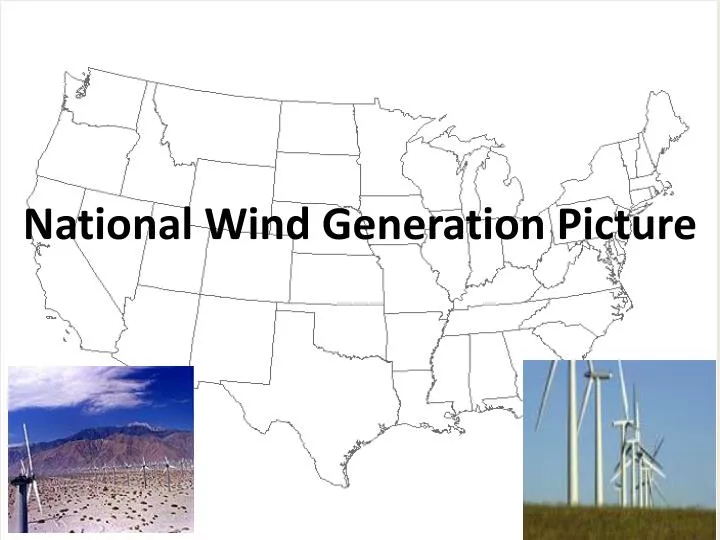
National Wind Generation Picture. Outline. US energy today Legislative landscape The future Long-term national planning Conclusions. US energy today: Existing US resource mix by capacity. Source: AWEA 2009 Annual Wind Report. US energy today: Retail Prices - 2007. US energy today:

E N D
Outline US energy today Legislative landscape The future Long-term national planning Conclusions
US energy today: • Existing US resource mix by capacity Source: AWEA 2009 Annual Wind Report
US energy today: • Retail Prices - 2007
US energy today: • US wind capacity historical growth Source: AWEA 2009 Annual Wind Report
1. US energy today: Wind capacity by state Source: AWEA Website: www.awea.org
1. US energy today: Wind capacity and 2008 growth by state ? ? ? ? ? ? Source: AWEA Website: www.awea.org
US energy today: • Wind % capacity by state Source: AWEA 2009 Annual Wind Report
US energy today: • Market share of total US wind fleet Source: AWEA 2009 Annual Wind Report
US energy today: • Market share of 2008 wind installations Source: AWEA 2009 Annual Wind Report
US energy today: • Ownership by company and by utility Source: AWEA 2009 Annual Wind Report
US energy today: • Power purchase agreements+ownership Source: AWEA 2009 Annual Wind Report
US energy today: • Wind plant size Source: AWEA 2009 Annual Wind Report
2. Legislative landscape: Renewable portfolio standards (on energy) • 29 states, differing in % (10-40), timing (latest is 2030), eligible technologies/resources (all include wind) WA: 15% by 2020* ME: 30% by 2000 New RE: 10% by 2017 VT: (1) RE meets any increase in retail sales by 2012; (2) 20% RE & CHP by 2017 MN: 25% by 2025 (Xcel: 30% by 2020) MT: 15% by 2015 • NH: 23.8% by 2025 ND: 10% by 2015 MI: 10% + 1,100 MW by 2015* • MA: 15% by 2020+1% annual increase(Class I Renewables) • OR: 25% by 2025(large utilities)* 5% - 10% by 2025 (smaller utilities) SD: 10% by 2015 WI: Varies by utility; 10% by 2015 goal • NY: 24% by 2013 RI: 16% by 2020 CT: 23% by 2020 • NV: 25% by 2025* IA: 105 MW • OH: 25% by 2025† • CO: 20% by 2020(IOUs) 10% by 2020 (co-ops & large munis)* • PA: 18% by 2020† WV: 25% by 2025*† • IL: 25% by 2025 • NJ: 22.5% by 2021 CA: 33% by 2020 UT: 20% by 2025* KS: 20% by 2020 VA: 15% by 2025* • MD: 20% by 2022 • MO: 15% by 2021 • AZ: 15% by 2025 • DE: 20% by 2019* • NC: 12.5% by 2021(IOUs) 10% by 2018 (co-ops & munis) • DC: 20% by 2020 • NM: 20% by 2020(IOUs) • 10% by 2020 (co-ops) TX: 5,880 MW by 2015 29 states & DChave an RPS 6 states have goals HI: 40% by 2030 State renewable portfolio standard Minimum solar or customer-sited requirement * State renewable portfolio goal Extra credit for solar or customer-sited renewables † Solar water heating eligible Includes non-renewable alternative resources
2. Legislative landscape: Tax incentives • Federal Incentives: • Renewed incentives Feb 2009 through 12/31/12, via ARRA • 2.1 cents per kilowatt-hour PTC,or 30% investment tax credit (ITC) • State incentives: • IA: 1.5¢/kWhr, small wind, Utah, Oklahoma, • Various other including sales & property tax reductions
2. Legislative landscape: Federal, congressional bills See http://www.grist.org/article/2009-06-03-waxman-markey-bill-breakdown/
2. Legislative Landscape Building Transmission $60 billion AEP plan Joint Coordinated System Plan (20%wind). Cost: $82 billion (2024 $)
2. Legislative Landscape Building Transmission • Multi-state transmission is very difficult • FERC’s authority – national interest corridors • Regional efforts • 2008: Uppr Mdwst Trns Dvlpmnt Initiative: MN,ND,SD,IA,WI • 2008: Joint Coord Sys Planning: MISO, PJM, SPP, TVA, MAPP • 2010: DOE transmission planning grants: • Eastern Interconnection Planning Collaborative: PJM, NYISO, ISO-NE, MISO, SoCo, TVA, MAPP, Entergy • WECC: Most of the western companies • Will FERC mandate if a state rejects T-plans?
3. The future: US wind potential by state Annual wind energy potential (1012 w-hrs) Annual wind energy potential R= ------------------------------------------ 2006 state annual retail sales States with high production and R-ratio have high export potential (Montana, Dakotas, Wyoming, Nebraska, Kansas) Analysis assumes (a) only sites having capacity factor > 20% included; (a) loss of 20% and 10% of potential power for onshore and offshore, respectively, caused by interturbine interference, (c) offshore siting distance within 50 nm (92.6 km) of nearest shoreline. Source: Xi Lua, M. McElroya, and J. Kiviluomac, “Global potential for wind-generated electricity,” Proc. of the National Academy of Sciences, 2009, www.pnas.orgcgidoi10.1073pnas.0904101106.
3. The future: US wind potential • Total 2008 US Energy consumption across all sectors is 100 Quads: Source: Xi Lua, M. McElroya, and J. Kiviluomac, “Global potential for wind-generated electricity,” Proc. of the National Academy of Sciences, 2009, www.pnas.orgcgidoi10.1073pnas.0904101106.
Long-term national planning: How wind fits in
Energy system: Electric, Fuels, Transportation LIQUID FUEL NATURAL GAS ELECTRIC RAIL Interstate AIR
Energy system: Today US ENERGY USE IS 69% ELECTRIC & TRANSPORTATION GREENING ELECTRIC & TRANSPORTATION ENERGY SOLVES THE EMISSIONS PROBLEM US CO2 EMISSIONS IS 74% ELECTRIC & TRANSPORTATION
Energy system: Today Electric Generation 39.97 Solar, 0.09 Unused Energy (Losses) 57.07 8.45 12.68 Nuclear, 8.45 27.39 6.82 20.54 Hydro, 2.45 Wind, 0.51 Residential 11.48 Geothermal 0.35 Natural Gas 23.84 Used Energy 42.15 Commercial 8.58 Industrial 23.94 Coal 22.42 8.58 20.9 Biomass 3.88 Trans-portation 27.86 Petroleum 37.13 26.33 6.95 LightDuty: 17.12Q Freight: 7.55Q Aviation: 3.19Q 24
Energy System: Transport goes electric! A modified French high-speed train has set a new world speed record for a train on conventional rails of 357 mph. World's first all-electric locomotive has over 1,000 batteries, runs 24 hours on a single charge. Warren Buffet's MidAmerican Energy Holdings bought 9.9% of BYD for $232 million.
INCREASE Non-CO2 12Q to 30Q USE 11Q Electric for transportation 4.5Q A possible future Electric Generation 49.72 Solar, 1.0 Unused Energy (Losses) 43.0 15 12.68 Nuclear, 15 25.7 6.82 20.54 Hydro, 2.95 Wind, 8.1 Residential 11.48 Geothermal 3.04 REDUCE COAL 21Q TO 12Q Natural Gas 23.84 Used Energy 42.15 Commercial 8.58 IGCC, 3 Industrial 23.94 Old Coal 10.42 8.58 8.5 Biomass 3.88 Trans-portation 15.5 Petroleum 15.13 26.33 6.95 REDUCE PETROLEUM 37Q15Q LightDuty: 8.56Q Freight: 3.75Q Aviation: 3.19Q
Total US 2007 GHG If we achieve this worldwide by 2035, there is a 75% chance of not exceeding the 2 degree guardrail. Infrastructure planning: Environmental Impacts 22Quads Petroleum reduction×156.4lbs/MBTU*0.4535 =1560 MMT CO2 12Q Old Coal reduction×212.7lbs/MBTU*0.4535 =1157 MMT CO2 ----------------------------------------------------------------------------------------------------------- TOTAL CO2 REDUCTION= 2717 MMT CO2
Infrastructure planning: Unit Costs *Environmental cost s assumed to be $1.5/MWhr, for nuclear, $3/MWhr for conventional coal, and $1.5/MWhr for clean coal.
Infrastructure planning: Solution explanation Why do we reduce production cost and emissions? Coal-fired power plants Because we reduced the use of combustion! Internal combustion engines
Infrastructure planning: more questions GEOTHERMAL SOLAR CLEAN-FOSSIL Where, when, & how to interconnect? NUCLEAR BIOMASS Wind
Conclusions Wind resource not large player today. Legislative landscape intent on changing that. US wind energy potential: could supply 2ב08 total (100Q) energy consumption. Wind must be a major player in economic solutions to global warming. 710 GW of wind by 2035, plus a little of all other non-CO2 resources, represents US contribution towards a feasible solution to global warming.