Download
1 / 12
120 likes | 251 Views
Wind Generation Improvements over Time. Long Term Study Meeting. Summary. Wind generation has improved in terms of potential annual capacity factors, increased capacity size, and ability to generate electricity in lower wind speeds Various improvements include: Longer rotors

E N D
Wind Generation Improvements over Time Long Term Study Meeting
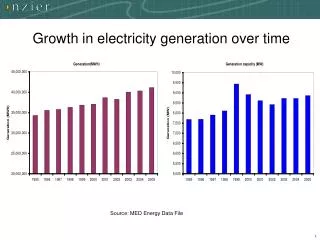
Summary • Wind generation has improved in terms of potential annual capacity factors, increased capacity size, and ability to generate electricity in lower wind speeds • Various improvements include: • Longer rotors • Increased efficiency in the nacelle (shaft, brake, generator, yaw) • Improved software operating the turbines • These improvements have resulted in an increase of the annual capacity factors of wind turbines from the 30% to 40% range to the 35% to 50% range • Capacity Factor = Output (MWh)/ (Max Capacity * Hours in Period)
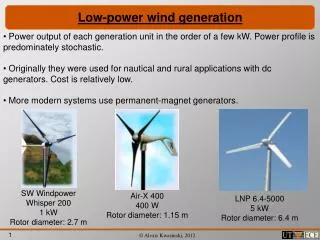
Evolution of the Rotors • Simple rule: The longer the rotor, the higher the output and the higher the capacity factor
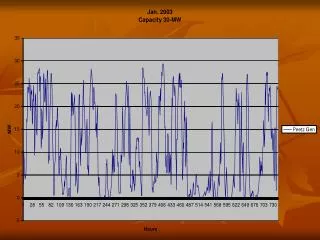
Rotor Length, Capacity Factor, and Output at Peak Hours • One of the turbine manufacturers went from 77 meters to 82 meters on the same tower size and had a 9% increase (39% to 48%) in potential capacity factor • The increase surface area impacted the capacity factor • In addition, software changes have been implemented which increased the potential capacity factor an additional 4% (48% to 52%) • Turbine output levels are increased at the higher wind speeds • Additionally, these new turbines have a higher output level at lower levels of wind speed • Location differences will also impact actual output
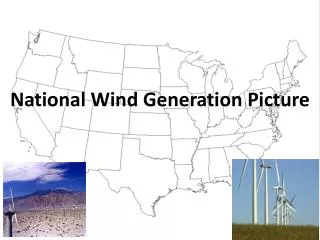
Comparison of New and Old Wind Expansion Resources • In the BAU and BAU with Retirements, the older expansion unit curves were used. • It consisted of only 1 curve for all expansion units. • In the next 4 slides, these curves are referred to as “Original Expansion”. • For the other scenarios, the study has used the new AWS wind curves which are from multiple sites in multiple counties. • The average annual capacity factor of the Non-Coastal expansion units is 46.1%. • The average annual capacity factor of the Coastal Expansion units is 35.9%. • In the next 4 slides, the Non-Coastal curve is from a wind farm in Carson county. • In the next 4 slides, the Coastal curves is from a wind farm in Willacy county.
Why should stakeholders care? • The higher capacity factors result in more hours in which these turbines earn revenue from both the Locational Marginal Prices (LMPs) and the Production Tax Credits (PTC) • In addition, the ability of the wind farms to produce higher output at lower wind speeds increases the potential contribution at peak hours • This analysis does not account for curtailed wind or wind output coincident with ERCOT system peak