Download
1 / 1
10 likes | 166 Views
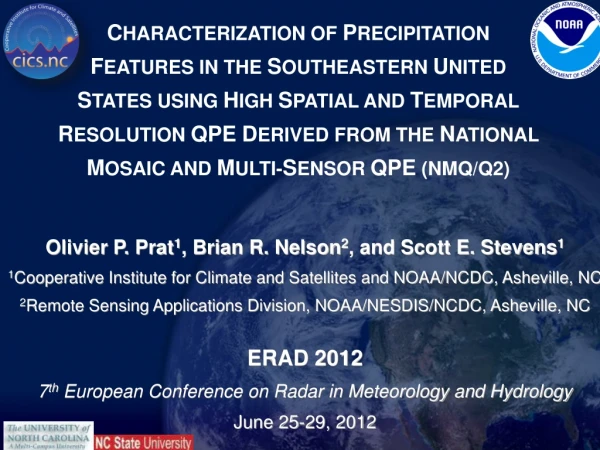
H41I-1280. Steps toward a CONUS-wide reanalysis with archived NEXRAD data using National Mosaic and Multisensor QPE (NMQ/Q2 ) algorithms. Scott E. Stevens 1 , Brian R. Nelson 2 , Carrie Langston 3 , and Youcun Qi 3. 1 CICS-NC, Asheville, NC; 2 NCDC, Asheville, NC; 3 CIMMS, Norman, OK.

E N D
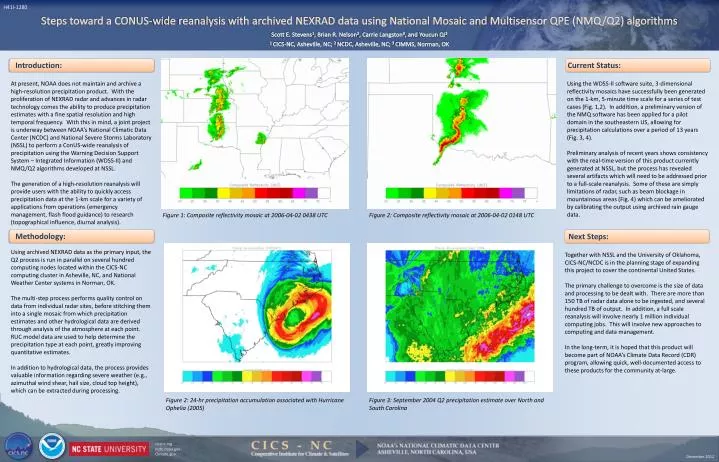
H41I-1280 Steps toward a CONUS-wide reanalysis with archived NEXRAD data using National Mosaic and Multisensor QPE (NMQ/Q2) algorithms Scott E. Stevens1, Brian R. Nelson2, Carrie Langston3, and Youcun Qi3 1 CICS-NC, Asheville, NC; 2 NCDC, Asheville, NC; 3 CIMMS, Norman, OK Introduction: Current Status: At present, NOAA does not maintain and archive a high-resolution precipitation product. With the proliferation of NEXRAD radar and advances in radar technology comes the ability to produce precipitation estimates with a fine spatial resolution and high temporal frequency. With this in mind, a joint project is underway between NOAA’s National Climatic Data Center (NCDC) and National Severe Storms Laboratory (NSSL) to perform a ConUS-wide reanalysis of precipitation using the Warning Decision Support System – Integrated Information (WDSS-II) and NMQ/Q2 algorithms developed at NSSL. The generation of a high-resolution reanalysis will provide users with the ability to quickly access precipitation data at the 1-km scale for a variety of applications from operations (emergency management, flash flood guidance) to research (topographical influence, diurnal analysis). Using the WDSS-II software suite, 3-dimensional reflectivity mosaics have successfully been generated on the 1-km, 5-minute time scale for a series of test cases (Fig. 1,2). In addition, a preliminary version of the NMQ software has been applied for a pilot domain in the southeastern US, allowing for precipitation calculations over a period of 13 years (Fig. 3, 4). Preliminary analysis of recent years shows consistency with the real-time version of this product currently generated at NSSL, but the process has revealed several artifacts which will need to be addressed prior to a full-scale reanalysis. Some of these are simply limitations of radar, such as beam blockage in mountainous areas (Fig. 4) which can be ameliorated by calibrating the output using archived rain gauge data. Figure 1: Composite reflectivity mosaic at 2006-04-02 0438 UTC Figure 2: Composite reflectivity mosaic at 2006-04-02 0148 UTC Methodology: Next Steps: Using archived NEXRAD data as the primary input, the Q2 process is run in parallel on several hundred computing nodes located within the CICS-NC computing cluster in Asheville, NC, and National Weather Center systems in Norman, OK. The multi-step process performs quality control on data from individual radar sites, before stitching them into a single mosaic from which precipitation estimates and other hydrological data are derived through analysis of the atmosphere at each point. RUC model data are used to help determine the precipitation type at each point, greatly improving quantitative estimates. In addition to hydrological data, the process provides valuable information regarding severe weather (e.g., azimuthal wind shear, hail size, cloud top height), which can be extracted during processing. Together with NSSL and the University of Oklahoma, CICS-NC/NCDC is in the planning stage of expanding this project to cover the continental United States. The primary challenge to overcome is the size of data and processing to be dealt with. There are more than 150 TB of radar data alone to be ingested, and several hundred TB of output. In addition, a full scale reanalysis will involve nearly 1 million individual computing jobs. This will involve new approaches to computing and data management. In the long-term, it is hoped that this product will become part of NOAA’s Climate Data Record (CDR) program, allowing quick, well-documented access to these products for the community at-large. Figure 2: 24-hr precipitation accumulation associated with Hurricane Ophelia (2005) Figure 3: September 2004 Q2 precipitation estimate over North and South Carolina cicsnc.orgncdc.noaa.gov Climate.gov December 2012


![[E;+] Example:S 3 ={e, 1 , 2 , 3 , 4 , 5 }](https://cdn2.slideserve.com/3765895/slide1-dt.jpg)