Download
1 / 16
160 likes | 163 Views
This study characterizes precipitation features in the Southeastern United States using high-resolution QPE data. It compares the results with satellite products and rain gauge data to assess accuracy. The study also examines seasonal patterns and differences between different precipitation events.

E N D
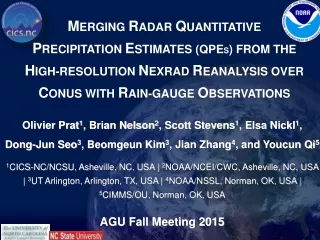
Characterization of precipitation features in the Southeastern United States using high spatial and temporal resolution qPEderived from the National Mosaic and Multi-sensor QPE (NMQ/Q2) Olivier P. Prat1, Brian R. Nelson2, and Scott E. Stevens1 1Cooperative Institute for Climate and Satellites and NOAA/NCDC, Asheville, NC 2Remote Sensing Applications Division, NOAA/NESDIS/NCDC, Asheville, NC ERAD 2012 7th European Conference on Radar in Meteorology and Hydrology June 25-29, 2012
Outline • NMQ Reanalysis: 1998-2010 for a pilot domain (9 NEXRAD) • Precipitation: Seasonal, daily, hourly, by event • NMQ Comparison with: • TRMM Satellite products (2A25, 3B42) • Rain gauge data (70 RG in dense Network) • Conclusion and Future work ERAD 2012 25-29 June, Toulouse
National Mosaic and Multi-sensor QPE (NMQ/Q2) • Developed at the National Severe Storms Laboratory (NSSL) • Estimates of Precipitation • Primary surface Radar based • Incorporates RUC model data and gauge networks • Represents significant step in resolution • 1-km spatial resolution • 5-min temporal resolution ERAD 2012 25-29 June, Toulouse
NMQ ERAD 2012 25-29 June, Toulouse
NMQ Reanalysis Pilot Project (1998-2010) • 9 Radar Sites over the Carolinas • 13-yr of Level II data • Collaboration CICS-NC, NCDC, NSSL, RENCI, NC State Univ. • Data Management and organization • TBs of data • CPUs 70 RGs ERAD 2012 25-29 June, Toulouse
NMQ/Q2 : Seasonal Precipitation (1km) Side Lobe Blockage Buildings Blockage Terrain Winter Spring Fall Gulf Stream Summer Sea Breeze Comparable patterns for winter and spring with precipitation moving upward toward Midwestern states. Opposite pattern for winter and summer. Strong positive contribution along the coasts and along the Gulf Stream. Positive contribution in fall along the coasts due to predominant TC activity. Comparable patterns for winter and spring with precipitation moving upward toward Midwestern states. Opposite pattern for winter and summer. Strong positive contribution along the coasts and along the Gulf Stream. Positive contribution in fall along the coasts due to predominant TC activity.
NMQ/Q2 : Maximum Daily Precipitation Tropical Cyclones Winter Storm/Snow Winter Spring Fall Summer Floyd (1999) Isabel (2003) Comparable patterns for winter and spring with precipitation moving upward toward Midwestern states. Opposite pattern for winter and summer. Strong positive contribution along the coasts and along the Gulf Stream. Positive contribution in fall along the coasts due to predominant TC activity. Comparable patterns for winter and spring with precipitation moving upward toward Midwestern states. Opposite pattern for winter and summer. Strong positive contribution along the coasts and along the Gulf Stream. Positive contribution in fall along the coasts due to predominant TC activity.
NMQ/Q2 : Maximum Hourly Precipitation Seasonal Distribution of Storms Storm Tracks Winter Spring Fall Summer Comparable patterns for winter and spring with precipitation moving upward toward Midwestern states. Opposite pattern for winter and summer. Strong positive contribution along the coasts and along the Gulf Stream. Positive contribution in fall along the coasts due to predominant TC activity. Comparable patterns for winter and spring with precipitation moving upward toward Midwestern states. Opposite pattern for winter and summer. Strong positive contribution along the coasts and along the Gulf Stream. Positive contribution in fall along the coasts due to predominant TC activity.
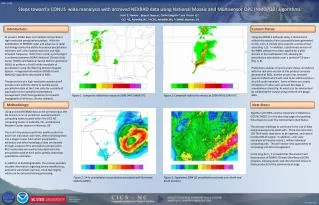
Precipitation Features : Warm Season Event Hurricane Frances (2004/09/07 : 1235UTC) 3-hr 5-min 25-km 5-km 1-km • Comparable patterns for rainfall distribution • Local differences (beam blocking, rain-rate estimation algorithms, sensors, sites processed …) 1200UTC 1235UTC 1-km 1235UTC ERAD 2012 25-29 June, Toulouse
Precipitation Features : Cold Season Event 2004 Christmas Eve Snowstorm (2004/12/26 : 0230UTC) 3-day 5-min 25-km 5-km 1-km • Higher instant precipitation for NMQ than for TPR 2A25 1200UTC 0230UTC • Higher 3-day Accumulation for NMQ with more detailed pattern at the ground 1-km ERAD 2012 25-29 June, Toulouse
Seasonal differences TPR 2A25 and NMQ (5km) • Important differences over the mountains (beam blocking) 2A25 Summer Diff. Summer NMQ Summer • WINTER & SPRING : TPR 2A25 > NMQ • SUMMER & FALL : NMQ > TPR 2A25 ERAD 2012 25-29 June, Toulouse
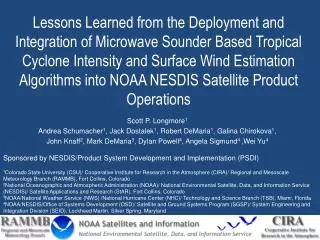
Seasonal differences TMPA 3B42 and NMQ (25km) • Important differences over the mountains (beam blocking) Winter Spring Fall • Important differences along the coasts (sea breeze) Summer ERAD 2012 25-29 June, Toulouse
Seasonal PDFs (1998-2010) NMQ TRMM 3B42 • Higher seasonal variability for NMQ/Q2 PDFs • Summer NMQ/Q2 PDF indicates higher rain rates (convective events) • Winter NMQ/Q2 PDF indicates a more widespread rain rate contribution (cold precipitation: snow, mixed phase …) • Lower Avg. Rain Rate (-11%) for NMQ during the cold season (DJF-SON) • Higher Avg. Rain Rate (+17%) for NMQ during the warm season (MAM-JJA) • Higher Annual Rain Rate for NMQ (+8%) ERAD 2012 25-29 June, Toulouse
Low/High Rain Rate Contribution NMQ TRMM 3B42 • Higher contribution for Q2 in the low rain intensity domain (RR<1mm/h) • Higher sensitivity for low rain-rate detection • Higher contribution for Q2 in the high intensity domain (RR>10mm/h) • Increased ability to resolve short lived intense precipitation events (thunderstorms, convective events …) ERAD 2012 25-29 June, Toulouse
Diurnal Cycle : RG and NMQ Winter RG_DJF=2.21 mm/day NMQ_DJF=2.11 mm/day RG_JJA=3.78 mm/day NMQ_JJA=3.66 mm/day NMQ_JJA=3.66 mm/day Summer ERAD 2012 25-29 June, Toulouse
Conclusion and Future Work PRECIPITATION FEATURES AT HIGH RESOLUTION (NMQ/Q2) : Good agreement between average RR derived from Q2 and 3B42 (+8% yearly) Higher inter-seasonal differences for the PDFs derived from NMQ than 3B42. Important local differences due to beam blockage over the mountains. Necessity of a global MULTI-SENSOR approach to assess reliable precipitation estimates FUTURE WORK: REANALYSIS Extend the current domain of study to 32 radars and the entire CONUS Improve artifact identification/removal (Beam Blockage, AP, …) Incorporate rain gauge measurements to adjust Q2 rain accumulation (RG adjusted products) FUTURE WORK: COMPARISON Impact of T/S resolution on precipitation features Diurnal Cycle at fine scale Precipitation Types (Stra/Conv) Precipitation Phases (Liquid/Frozen) PDFs (low/extremes RR) This work is supported by the Cooperative Agreement NOAA Grant NA09NES4400006 ERAD 2012 25-29 June, Toulouse