Download
1 / 18
190 likes | 347 Views
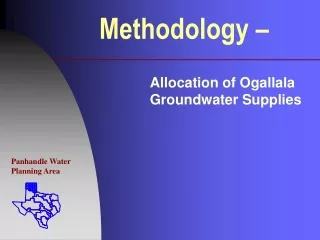
LandFire Methodology. The Coeur d'Alene Tribe is learning the remote sensing methodology developed by LANDFIRE, and will be attempting to apply the methods to higher resolution 1-meter imagery.

E N D
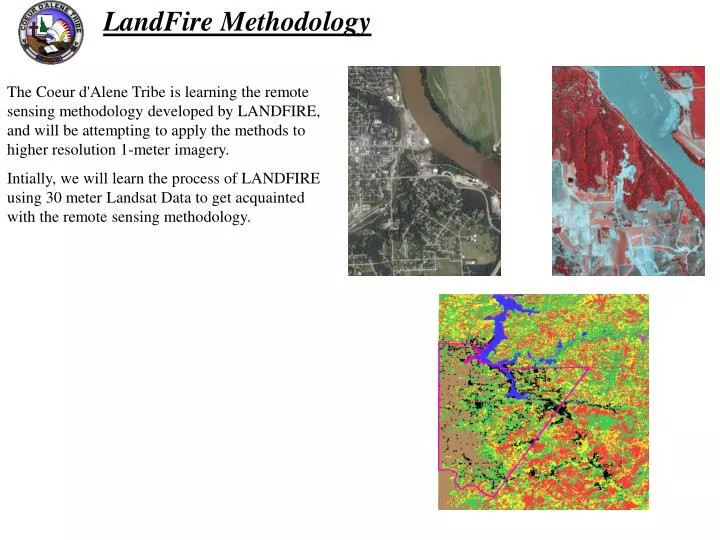
LandFire Methodology The Coeur d'Alene Tribe is learning the remote sensing methodology developed by LANDFIRE, and will be attempting to apply the methods to higher resolution 1-meter imagery. Intially, we will learn the process of LANDFIRE using 30 meter Landsat Data to get acquainted with the remote sensing methodology.
Issues • Is the process worth investing in to get useable tools to help us make better • decisions, not necessarily fight fires, but suppress, or treat on tribal lands???thoughts • Landfire methodology is intended for a National Scale project – but methods could be • used at a finer scale for local use. • Number of plots is scarce for Tribal Organizations, as well as expertise to produce these • layers.
LandFire Methodology Canopy Height Vegetation In a recent visit to the USGS EROS Data Center (EDC), the Coeur d’Alene Tribe GIS team was exposed to and taught the remote sensing methodologies used in producing LANDFIRE preliminary products. EROS Data Center-Sioux Falls, SD As part of the overall Landfire process, the technical team at the USGS EROS Data Center (EDC) has the task of developing near current (circa 2001) vegetation and vegetation structure datasets.
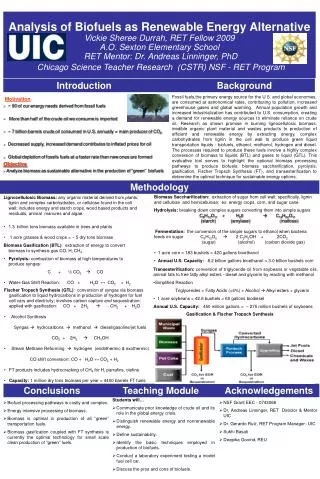
Landfire Methodology The figure below illustrates the data inputs, processes, and end products produced for the LANDFIRE project by EDC. In this flow chart three primary “blocks” are used to identify the major components within the data development process.
Landfire Methodology Basically the remote sensing methods utilized by EDC use field data (FIA, CFI, FIREMON) to model certain attributes such as current vegetation, height, and canopy cover. A wide variety of other data such as satellite imagery, climate, soils, and elevation are incorporated into the model. After pre-processing, the input data are utilized in two modeling packages as shown in the modeling block of the previous diagram. The See5 model software is a data mining, decision tree package that is used for developing discrete variable output (vegetation classes). The Cubist software is used to develop regression trees used for continuous variable output (i.e. percent canopy, average tree height). See5 modeling software Cubist modeling Software CDA field data Regression Tree Output
Overview • Classification Tree – C5/See5 • Predicts categorical variables like Land cover, vegetation, etc. • Regression Tree – Cubist • Predicts continuous variables like Canopy cover, height, etc. • Both require the generation of two files – • *.data file –extracted values from Input layers • *.names file- points to where all the input layers are located
Major Steps in Developing a Spatial Classification (map) using C5 • Collect training points (CFI, FIREMON) • Develop a classification tree model (aka decision tree, or d-tree) via See5, Cubist • Apply the model spatially to create a map
List of what we used in models: Three dates of LandSat 7 data Leaf on, Leaf off, Spring dates • One of the most time consuming tasks is to get all your input data ready for processing. • Dem • Slope • Aspect • Soils (Silc dataset) • B9 – Brightness of all three dates • NDVI – Vegetation Indices for all three dates • Reflectance – Reflectance for all three dates • Tassel Cap – for all three dates
Preliminary Results: Herbaceous Vegetation Classification Forest Canopy Cover Classification Herbaceous Height Classification Final Vegetation Classification
Tree: Height > 10m, Canopy > 40% Tree: Height > 10m, Canopy <= 40% Tree: Height <= 10m, Canopy > 40% Tree: Height <= 10m, Canopy <= 40% Shrub: Height > 1m, Canopy > 40% Shrub: Height > 1m, Canopy <= 40% Shrub: Height <= 1m, Canopy > 40% Shrub: Height <= 1m, Canopy <= 40% Herbaceous: Height > 0.2m, Canopy > 40% Herbaceous: Height > 0.2m, Canopy <= 40% Herbaceous: Height <= 0.2m, Canopy > 40% Herbaceous: Height <= 0.2m, Canopy <= 40% Utah Existing Structural Stages
FireLab processing Based on fire behavior expertise and knowledge they assign one of the 13 fuel models (Anderson 82) based on the layers that EROS provides. They have about 10 different ways to derive a fuels layer? This process is relatively new process for everyone including the Firelab, EROS, and it is not an exact science.
Historical fire regime Existing vegetation Potential vegetation mapping Potential vegetation Condition Class Existing vegetation mapping Fuels Structure class Landscape Simulation Fuels Fuel and fuel loading models FIREHARM Topography/Edaphic Fire Danger Climate Ecophysiological The Firelab also processes different deliverables for the Landfire program, but since the CDA project is primarily focused on producing input layers for Farsite, we Didn’t learn how to produce the full suite of Landfire products. What we are interested in mapping They did however share a program called Fuelcalc, which is a very simple Looking program that calculates certain attributes needed for modeling Farsite Inputs like Crown Bulk Density, Canopy base height, Canopy stand height, etc.
Mapped Deliverables (Fuels) l Canopy Height Canopy Cover Crown Bulk Density Canopy Base Ht They did however share a program called Fuelcalc, which is a very simple Looking program that calculates certain attributes needed for modeling Farsite Inputs like Crown Bulk Density, Canopy base height, Canopy stand height, etc.
Where do we go from here??? • From what you have experienced this week, is this something Tribal • organizations are interested in, is it useful?? • There is no standard for applying this methodology to a localized • scale, so we would like other tribal agencies to help in creating a standard • for producing what we need in the field. • If this is not a feasible way to approach mapping fuels, what other ways • can we help manage fuels?? Suggestions?? • If interested, the CDA tribe GIS program is willing to share what we • have learned and support other tribal folks in mapping fuels. As well as • establishing a “Tribal Network” to tailor this technology to better meet Tribal needs.
Any Questions? Contact Info:James TwoteethGIS Analystjtwoteeth@cdatribe-nsn.gov