Download
1 / 21
220 likes | 376 Views
Transport Measurements in Pulsed fields. Jon Betts. Head of User Operations NHMFL-PFF. Outline. Pulsed magnet cell setup Cryogenics Probes Mounting the sample Taking the data Driving the sample Measuring the sample Analyzing the data What can go wrong!. Connections to thermometer,

E N D
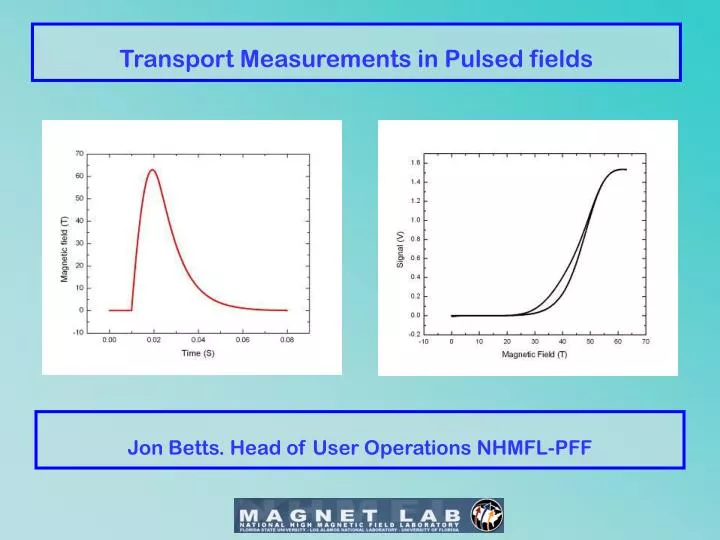
Transport Measurements in Pulsed fields Jon Betts. Head of User Operations NHMFL-PFF
Outline • Pulsed magnet cell setup • Cryogenics • Probes • Mounting the sample • Taking the data • Driving the sample • Measuring the sample • Analyzing the data • What can go wrong!
Connections to thermometer, field coil and sample Sample Probe to He3 pump to He4 pump He3 He4 He4 cryostat LN2 to Capacitor bank G10 Blast Box Sample at field center Pulsed magnet Pulsed Magnet Cell Setup
8.2mm id G10 Tube Coated with Stycast 2850 Charcoal Pump 3/8” x 0.010W St/St tube 7/16” x 0.010W St/St tube G10 Spacer Cryogenics Schematic of He3 Fridge
Actual He3 Fridges Plastic (G10 caoted with Stycast 2850) Stainless Steel outer Coated G10 inner
Probe Ends (Top and Bottom) Shielded twisted pair probe Probe top Tri-ax probe Shielded twisted pair
The good, the bad and………. Bare 8 pin connector 8mm Nice wire bonding! Lots! Of silver paint!
Driving the Sample • AC sine wave constant current (10KHz – 200KHz) • Why not DC? • Thermo-electric potentials. • Voltage pick-up from the pulse of the magnet at about 40 Hz. Caused by dB/dt. (When the flux through a loop of wire changes, a voltage is induced in that wire. The voltage is directly proportional to dB/dt, and to the area enclosed by the loop of wire.) • Use an AC excitation current and a lock-in amplifier. The dB/dt signal gets rejected by the narrow bandwidth of the lock-in amplifier.
The Digital Lockin The hardware • Three independent synchronously locked outputs • Variable voltage sine wave • fixed voltage sine wave • Clock • Frequency of all three outputs can be varied in multiples of each other. • Fast external digitizer • Onboard Preamplifier with configurable settings
Load Resistor (RL) Differential amplifier + 10T 1000 T To Digitizer AC from Lockin Out (Vin) Transformer Current = (Vin/RL)/Ratio Constant Current
What can go wrong? • Sample heating Caused by eddy currents in a metallic sample • Sample heating caused by I2R heating ( samples with high magneto resistance). • Wire motion. • Grounding/noise issues • Cryogenic issues.