Download
1 / 32
320 likes | 414 Views
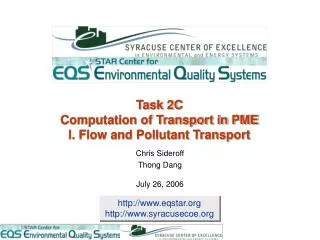
Street canyon aerosol pollutant transport measurements in Manchester. I.D. Longley , M.W. Gallagher, J.R. Dorsey, M. Flynn, K. Bower, I. Barlow J.R. Allan, M.R. Alfarra, H. Coe. Aerosol in Urban Street Canyons.

E N D
Street canyon aerosol pollutant transport measurements in Manchester I.D. Longley, M.W. Gallagher, J.R. Dorsey, M. Flynn, K. Bower, I. Barlow J.R. Allan, M.R. Alfarra, H. Coe Ian Longley
Aerosol in Urban Street Canyons • Fine aerosol, linked to adverse health effects (COMEAP, 2001, EPAQS,2000, Colville et al, 2001). • Fine aerosol from vehicle emissions. • Street canyons act as major emission sites. • Large numbers of people exposed. • Canyons re-circulate and trap pollutants. • Canyon emissions transported across and beyond city – affecting chemical and radiative atmospheric properties and the biosphere. • Need to understand transport within, and emission from, urban street canyons. Ian Longley
SCAR – Street Canyon Aerosol Research • Regulatory dispersion models are based upon a simple transport mechanism – PM10 only. • Numerical modelling – simple canyons. • Field studies are rare. • SCAR to apply eddy correlation techniques. • Aim: Parameterised size- segregated aerosol emission rates. Ian Longley
Experimental site – Princess Street, Manchester Ian Longley
SCAR measurements • SMPS (TSI 3080 + nano DMA) • OPC (PMS ASASP-X) • FSSP • 20 Hz sonic anemometers • 18m mast • Platform lift for profiling • Mobile turbulence system • 4 campaigns in 2001: (3 x 1 week, 1 x 2 weeks) Ian Longley
Mean ultrafine aerosol spectra • Left: SMPS spectrum from UMIST Land Rover Discovery TDi • Left: average SMPS spectrum from SCAR, 2m height Ian Longley
Aerosol Chemistry(from Aerosol Mass Spectrometer, J.R. Allen, M.R. Alfarra, H.Coe) • Mode in the mass spectra at around 100-200nm consisting of aliphatic organic chemicals. • Organic activity within the Manchester sampling periods correlates well with NOx activity. Ian Longley
Temporal variation in fine aerosol spectra (4.6nm<Dp<160nm) • Total number concentrations generally follow traffic flow • Road-side day-time concentrations are generally greater than night-time by a factor of around 4. • Day-time and night-time spectra are the same shape. Ian Longley
Mean air flow: Channelling Ian Longley
Mean air flow: Vertical flow Ian Longley
Mean air flow: Vertical flow Ian Longley
Mean air flow: Up-canyon Ian Longley
Mean air flow: NE perpendicular Ian Longley
Mean air flow: SW perpendicular Ian Longley
Influence of wind speed and direction on fine aerosol number concentrations – 1. PARALLEL FLOW Ian Longley
Influence of wind speed and direction on fine aerosol number concentrations – 2. NE PERPENDICULAR • Canyon vortex blows emissions away from instruments Ian Longley
Influence of wind speed and direction on fine aerosol number concentrations – 3. SW PERPENDICULAR • Canyon vortex blows emissions towards instruments • Flow at pavement level disconnected from roof-top wind Ian Longley
Vertical concentration gradients Ian Longley
Vertical concentration gradients Ian Longley
Accumulation mode (100nm<Dp<1mm) aerosol emission fluxes SCAR SASUA: Above Edinburgh* *Dorsey, J.R. et alAtmos. Environ. Vol.36, pp. 791-800. Ian Longley
Horizontal fluxes Ian Longley
Coarse particle fluxes SASUA All Experiments Aerosol Eddy Flux Measurements dp>1.9 mm Mode- CEH instrument Wind driven re-suspension Ian Longley
Vertical turbulence Ian Longley
Parameterisation for swTraffic-induced turbulence Ian Longley
Parameterisation for sw • = 0.16 at a height of 3.5m swt = 0.0135 T1/2 T = traffic flow rate (hr-1) Ian Longley
Turbulent variances: sw/U profiles Ian Longley
Turbulent variances: su/U profiles Ian Longley
Turbulent variances: sv/U profiles Ian Longley
Spatial variation in sw/U:1. Sheltered zone Plan views of canyon Above: U/Uroof Below: sw/U Ian Longley
Spatial variation in sw/U:2. Convergence Above: U Below: sw/U Ian Longley
Conclusions • The flux of accumulation mode aerosol (100nm<Dp<3mm) have been measured in a city centre street canyon and found to be related to urban heat emission and traffic activity. • Street-level fine aerosol has been shown to be influenced by asymmetrical vortex flow within the canyon. • A vertical gradient was found in fine aerosol number concentrations below roof level. • A weak positive vertical gradient was seen in turbulent variances. However, greatly enhanced variances were seen at the bottom of the canyon. • A parameterisation has been derived for sw based upon local wind speed and traffic flow rate. Ian Longley
Forthcoming analysis • More street-level accumulation mode flux data • Profiles of coarse aerosol concentrations • Improved parameterisation for wind-driven re-suspension • Spectral & quadrant analysis • SCAR-5: suburban street canyon • Improved parameterisation for turbulence, including traffic-layer turbulence Ian Longley