Download
1 / 38
380 likes | 484 Views
Enrollment & Demographic Analysis 1999-00 Through 2009-10. Texas Public Schools Enrollment by Ethnicity. Texas Public School Enrollment Growth by Ethnicity. Texas Public School Enrollment Growth by Ethnicity.

E N D
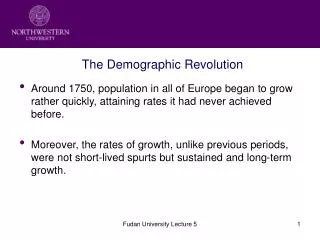
Hispanic children make up 91% of school enrollment growthSource: Houston Chronicle, Texas Politics • Hispanic children represent 91% of the public school enrollment increase over the past decade, according to Texas Education Agency statistics. • The current school year shows an overall enrollment of 856,061 students from the 1999-2000 school year. The number of Hispanic students has increased by 775,075. • The number of white children has declined by 106,510 during the past decade – about the same number as the increase in African American children.
Perhaps the most stunning statistic when it comes to school enrollment is the number of children from low income families. The number has increased by 893,055 over the past 10 years – exceeding the overall student enrollment growth. • The number of white children attending public schools is declining all across Texas. White children now make up less than 8 percent of the total enrollment in the Houston ISD and less than 5 percent of the Dallas ISD enrollment.
Rockwall ISD Enrollment Projections**Projections based on Rockwall ISD’s Average Annual Change for the Past 10-YRs , 5-YRs, and 3-YRs
Limited English Proficient (LEP) EnrollmentRockwall ISD vs Texas
Feeder Information • Rockwall ISD is divided into two Feeders: • Rockwall High School (RHS) Feeder • Rockwall-Heath High School (RHHS) Feeder • Feeder Enrollment includes Elementary, Middle School, and High School students by their designated campus attendance zone and enrollment path.
RHS Feeder Secondary Schools Elementary Schools Reinhardt Elementary Dobbs Elementary Cullins-Lake Pointe Elementary Nebbie Williams Elementary Hartman Elementary Hays Elementary * * Portion of students will attend either Utley MS or Williams MS • Rockwall High School • Williams Middle School • Utley Middle School
RHHS Feeder Secondary Schools Elementary Schools Rochell Elementary * Amy Parks-Heath Elementary Pullen Elementary Jones Elementary * Springer Elementary Shannon Elementary * * Portion of students will attend either Utley MS or Cain MS • Rockwall-Heath High School • Cain Middle School • Utley Middle School
Proportion of African American StudentsRHS Feeder vs RHHS Feeder
Proportion of Native American StudentsRHS Feeder vs RHHS Feeder
Proportion of Asian/Pacific Islander StudentsRHS Feeder vs RHHS Feeder
Proportion of Limited English Proficient (LEP) StudentsRHS Feeder vs RHHS Feeder
Proportion of Economically Disadvantaged StudentsRHS Feeder vs RHHS Feeder
Percentage of Area School Districts’ Students in Low-Income Families in 2009-10Source: Texas Education Agency
Rockwall ISD EthnicityElementary Enrollment & Gifted/Talented (K-6)As of June 3, 2010
Rockwall ISD EthnicityMiddle School Enrollment & Advanced Courses (7-8)As of June 3, 2010
Rockwall ISD EthnicityHigh School Enrollment & AP/Dual Credit (9-12)As of June 3, 2010
Rockwall ISD EthnicityTotal Enrollment & Special Education (K-12)As of June 3, 2010