Download
1 / 11
110 likes | 226 Views
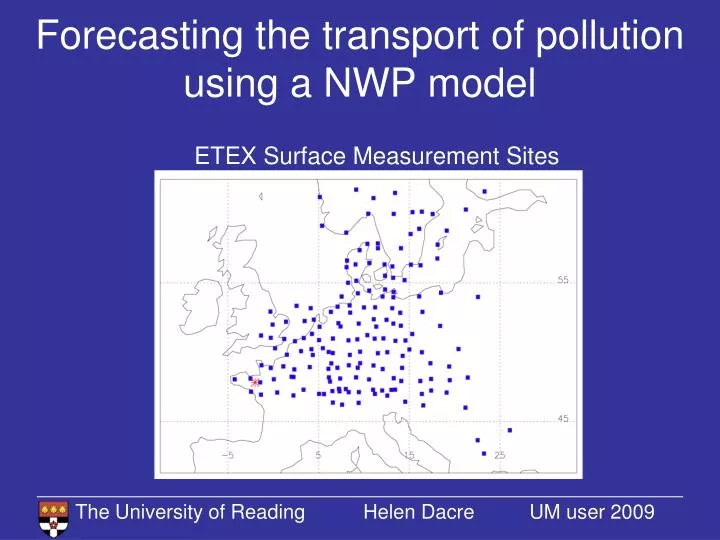
Forecasting the transport of pollution using a NWP model. ETEX Surface Measurement Sites. Aims. To determine the meteorological processes responsible for transporting tracer during ETEX 2

E N D
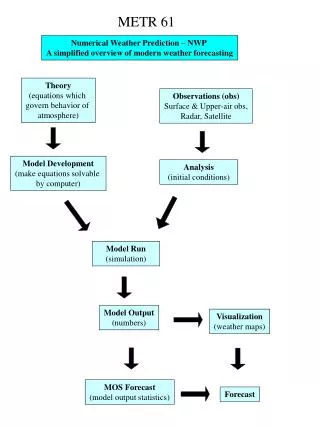
Forecasting the transport of pollution using a NWP model ETEX Surface Measurement Sites
Aims • To determine the meteorological processes responsible for transporting tracer during ETEX 2 • To assess the performance of the UK Met Office’s NWP model in predicting tracer concentrations during ETEX 2
Talk Outline • Overview of NWP model • Analysis of meteorological processes • Tracer transport in the UM • Horizontal • Vertical • Conclusions
UK Met Office Unified Model • Eulerian, non-hydrostatic NWP model • Includes parameterisations (boundary layer mixing, microphysics, convection) • Limited area model 12 km resolution • Tracer released into lowest model grid box • Tracers are passive LAM domain
Synoptic Analysis Frontal analysis at 00 UTC on 13th, 14th, 15th and 16/11/94 Modis visible 08UTC 14/11/94
Precipitation Fields Large-scale rain amount 15/10/94 03 UTC Convective rain amount 15/10/94 03 UTC
Horizontal Tracer Transport 15/11/94 03 UTC 15/11/94 15 UTC 16/11/94 03 UTC
Vertical Tracer Transport 15/11/94 03 UTC 15/11/94 15 UTC 16/11/94 03 UTC 15/11/94 15 UTC 16/11/94 03 UTC 288K 288K 287K 288K 287K 286K 287K 286K 285K 286K 285K 285K 15/11/94 03 UTC 15/11/94 15 UTC 15/11/94 15 UTC UM UM - no convection
Conclusions • A warm conveyor belt transported tracer up to height of 4km and tracer was transported further to 8km by convection • High resolution simulations needed to predict the change in wind direction and hence the observed tracer distribution • The representation of sub-grid scale processes in NWP models can affect the distribution of tracer • Accuracy of forecast is also sensitive to choice of model dynamics and accuracy of the meteorological forecast
Wind Direction at Release Site 360 315 270 225 180 50km Obs Wind direction (degrees) 12km cold front • 18 21 00 03 06 09 12 15 • 14/11/94 Time (UTC) 15/11/94