Download
1 / 45
450 likes | 673 Views
Forecasting Using the Simple Linear Regression Model and Correlation. What is a forecast?. Using a statistical method on past data to predict the future. Using experience, judgment and surveys to predict the future . Why forecast?. to enhance planning. to force thinking about the future.

E N D
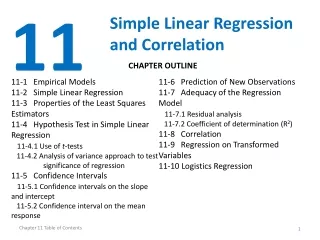
Forecasting Using the Simple Linear Regression Model and Correlation
What is a forecast? Using a statistical method on past data to predict the future. Using experience, judgment and surveys to predict the future.
Why forecast? • to enhance planning. • to force thinking about the future. • to fit corporate strategy to future conditions. • to coordinate departments to the same future. • to reduce corporate costs.
Kinds of Forecasts • Causal forecasts are when changes in a variable (Y) you wish to predict are caused by changes in other variables (X's). • Time series forecasts are when changes in a variable (Y) are predicted based on prior values of itself (Y). • Regression can provide both kinds of forecasts.
Types of Relationships Positive Linear Relationship Negative Linear Relationship
Types of Relationships (continued) Relationship NOT Linear No Relationship
Relationships • If the relationship is not linear, the forecaster often has to use math transformations to make the relationship linear.
Correlation Analysis • Correlation measures the strength of the linear relationship between variables. • It can be used to find the best predictor variables. • It does not assure that there is a causal relationship between the variables.
The Correlation Coefficient • Ranges between -1 and 1. • The Closer to -1, The Stronger Is The Negative Linear Relationship. • The Closer to 1, The Stronger Is The Positive Linear Relationship. • The Closer to 0, The Weaker Is Any Linear Relationship.
Graphs of Various Correlation (r) Values Y Y Y X X X r = -1 r = -.6 r = 0 Y Y X X r = 1 r = .6
The Scatter Diagram Plot of all (Xi ,Yi) pairs
The Scatter Diagram • Is used to visualize the relationship and to assess its linearity. The scatter diagram can also be used to identify outliers.
Regression Analysis Regression Analysis can be used to model causality and make predictions. Terminology: The variable to be predicted is called the dependent or response variable. The variables used in the prediction model are called independent, explanatory or predictor variables.
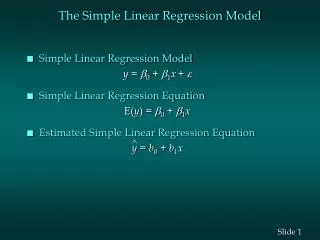
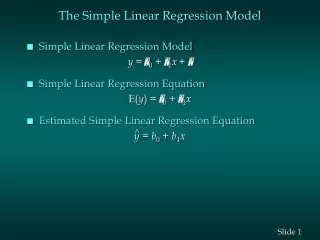
Simple Linear Regression Model • Therelationship between variables is described by a linear function. • A change of one variable causes the other variable to change.
Population Linear Regression • Population Regression Line Is A Straight Line that Describes The Dependence of One Variable on The Other Population SlopeCoefficient Random Error Population Y intercept Dependent (Response) Variable Independent (Explanatory) Variable PopulationRegression Line
How is the best line found? Y Observed Value = Random Error X Observed Value
Sample Linear Regression Sample Regression Line Provides an Estimate of The Population Regression Line SampleSlopeCoefficient Sample Y Intercept Residual Sample Regression Line provides an estimate of provides an estimate of
Simple Linear Regression: An Example Annual Store Square Sales Feet ($1000) 1 1,726 3,681 2 1,542 3,395 3 2,816 6,653 4 5,555 9,543 5 1,292 3,318 6 2,208 5,563 7 1,313 3,760 You wish to examine the relationship between the square footage of produce stores and their annual sales. Sample data for 7 stores were obtained. Find the equation of the straight line that fits the data best
The Scatter Diagram Excel Output
The Equation for the Regression Line From Excel Printout:
Graph of the Regression Line Yi = 1636.415 +1.487Xi
Interpreting the Results Yi = 1636.415 +1.487Xi The slope of 1.487 means that each increase of one unit in X, we predict the average of Y to increase by an estimated 1.487 units. The model estimates that for each increase of 1 square foot in the size of the store, the expected annual sales are predicted to increase by $1487.
The Coefficient of Determination SSR regression sum of squares r2 = = SST total sum of squares The Coefficient of Determination (r2 ) measures the proportion of variation in Y explained by the independent variable X.
Coefficients of Determination (R2) and Correlation (R) r2 = 1, r = +1 Y ^ Y = b + b X i 0 1 i X
Coefficients of Determination (R2) and Correlation (R) (continued) r2 = .81, r = +0.9 Y ^ Y = b + b X i 0 1 i X
Coefficients of Determination (R2) and Correlation (R) (continued) r2 = 0, r = 0 Y ^ Y = b + b X i 0 1 i X
Coefficients of Determination (R2) and Correlation (R) (continued) r2 = 1, r = -1 Y ^ Y = b + b X i i 0 1 X
Correlation:The Symbols • Population correlation coefficient (‘rho’) measures the strength between two variables. • Sample correlation coefficient r estimates based on a set of sample observations.
Example: Produce Stores From Excel Printout
Inferences About the Slope • t Test for a Population SlopeIs There A Linear Relationship between X and Y ? • Null and Alternative Hypotheses • H0: 1 = 0 (No Linear Relationship) H1: 1 0 (Linear Relationship) • Test Statistic: Where and df = n - 2
Example: Produce Stores Data for 7 Stores: Estimated Regression Equation: Annual Store Square Sales Feet ($000) 1 1,726 3,681 2 1,542 3,395 3 2,816 6,653 4 5,555 9,543 5 1,292 3,318 6 2,208 5,563 7 1,313 3,760 Yi = 1636.415 +1.487Xi The slope of this model is 1.487. Is Square Footage of the store affecting its Annual Sales?
Inferences About the Slope: t Test Example Test Statistic: Decision: Conclusion: • H0: 1 = 0 • H1: 1 0 • .05 • df7 - 2 = 5 • Critical value(s): From Excel Printout Reject H0 Reject Reject .025 .025 There is evidence of a linear relationship. t -2.5706 0 2.5706
Inferences About the Slope Using A Confidence Interval Confidence Interval Estimate of the Slope b1 tn-2 Excel Printout for Produce Stores At 95% level of Confidence The confidence Interval for the slope is (1.062, 1.911). Does not include 0. Conclusion:There is a significant linear relationship between annual sales and the size of the store.
Residual Analysis • Is used to evaluate validity of assumptions. Residual analysis uses numerical measures and plots to assure the validity of the assumptions.
Linear Regression Assumptions • 1. X is linearly related to Y. • 2. The variance is constant for each value of Y (Homoscedasticity). • 3. The Residual Error is Normally Distributed. • 4. If the data is over time, then the errors must be independent.
Residual Analysis for Linearity Y Y X X e e X X Not Linear Linear
Residual Analysis for Homoscedasticity Y Y X X e e X X Homoscedasticity Heteroscedasticity
Residual Analysis for Independence: The Durbin-Watson Statistic It is used when data is collected over time. It detects autocorrelation; that is, the residuals in one time period are related to residuals in another time period. It measures violation of independence assumption. Calculate D and compare it to the value in Table E.8.
Interval Estimates for Different Values of X Confidence Interval for the mean of Y Confidence Interval for a individual Yi Y Yi = b0 + b1Xi X _ A Given X X
Estimation of Predicted Values Confidence Interval Estimate for YX The Mean of Y given a particular Xi Size of interval vary according to distance away from mean, X. Standard error of the estimate t value from table with df=n-2
Estimation of Predicted Values Confidence Interval Estimate for Individual Response Yi at a Particular Xi Addition of 1 increases width of interval from that for the mean of Y
Example: Produce Stores Data for 7 Stores: Annual Store Square Sales Feet ($000) 1 1,726 3,681 2 1,542 3,395 3 2,816 6,653 4 5,555 9,543 5 1,292 3,318 6 2,208 5,563 7 1,313 3,760 Predict the annual sales for a store with 2000 square feet. Regression Model Obtained: Yi = 1636.415 +1.487Xi
Estimation of Predicted Values: Example Confidence Interval Estimate for YX Find the 95% confidence interval for the average annual sales for stores of 2,000 square feet Predicted Sales Yi = 1636.415 +1.487Xi = 4610.45 ($000) tn-2 = t5 = 2.5706 X = 2350.29 SYX = 611.75 = 4610.45 612.66 Confidence interval for mean Y
Estimation of Predicted Values: Example Confidence Interval Estimate for Individual Y Find the 95% confidence interval for annual sales of one particular store of 2,000 square feet Predicted Sales Yi = 1636.415 +1.487Xi = 4610.45 ($000) tn-2 = t5 = 2.5706 X = 2350.29 SYX = 611.75 = 4610.45 1687.68 Confidence interval for individual Y