Download
1 / 12
120 likes | 126 Views
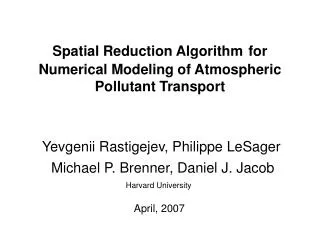
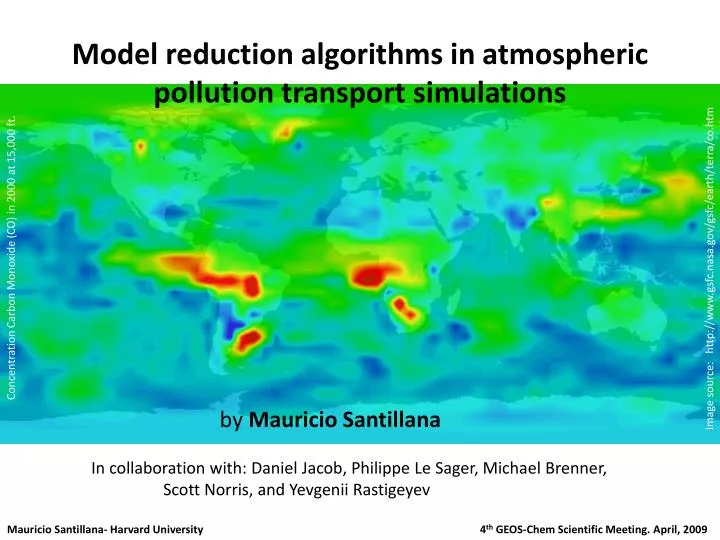
Model reduction algorithms in atmospheric pollution transport simulations. Concentration Carbon Monoxide (CO) in 2000 at 15,000 ft. Image source: http://www.gsfc.nasa.gov/gsfc/earth/terra/co.htm. by Mauricio Santillana.

E N D
Model reduction algorithms in atmospheric pollution transport simulations Concentration Carbon Monoxide (CO) in 2000 at 15,000 ft. Image source: http://www.gsfc.nasa.gov/gsfc/earth/terra/co.htm by Mauricio Santillana In collaboration with: Daniel Jacob, Philippe Le Sager, Michael Brenner, Scott Norris, and Yevgenii Rastigeyev Mauricio Santillana- Harvard University 4th GEOS-Chem Scientific Meeting. April, 2009
How does GEOS-Chem work? • In Every grid box in Earth’s Atmosphere (3D), • All chemical species are solved… • Focus: Standard tropospheric • ozone-NOx-VOC-aerosol simulation • (111 species being solved) http://celebrating200years.noaa.gov/breakthroughs/climate_model/ Mauricio Santillana- Harvard University 4th GEOS-Chem Scientific Meeting. April, 2009
However, do we need to solve all equations in all grid boxes? Observations Higher concentrations NO 2 Image credits: R.V. Martin (Dalhousie U.) Model reduction idea: Solve full equations only where most needed… Reasonable idea? Mauricio Santillana- Harvard University 4th GEOS-Chem Scientific Meeting. April, 2009
Examples: Isoprene and PAN Boxes where production or loss rate of NO > 10^2 mol/cm^3 sec P. Le Sager & M. Santillana July 8, 2004. 00Hrs GMT Inactive Active Mauricio Santillana- Harvard University 4th GEOS-Chem Scientific Meeting. April, 2009
Where are things happening? All species Percentage of species where production or loss rate > 10^2 mol/cm^3 sec P. Le Sager & M. Santillana July 8, 2004. 00Hrs GMT Mauricio Santillana- Harvard University 4th GEOS-Chem Scientific Meeting. April, 2009
Where are things happening? All species • Idea: • Divide domain in active/inactive regions (for each chemical species). • Solve for species that are active in each box. • Use a computationally cheaper method to calculate concentration for inactive species. 2 Why 10 threshold? 6 3 Example: OH Typical concentration = 10 mol / cm Life time = 1 sec. Negligible! Mauricio Santillana- Harvard University 4th GEOS-Chem Scientific Meeting. April, 2009
What do we do in inactive regions?Two Ideas: • 1. Alternative ODE solver • (Preliminary results) • Calculate concentration of species in inactive regions at each time step using an explicit ODE. • Decouples equations. • Cheaper than implicit! • Spatial exponential-decay extrapolation • (In progress) • Assume spatial exponential decay from essential regions • Calculate concentration of species in non-essential regions at each time step using a distance function to the chemical boundary layer • Ignore all mechanisms such as: transport, chemistry, deep convection, in non-essential regions Explicit solver (analytic expression) Mauricio Santillana- Harvard University 4th GEOS-Chem Scientific Meeting. April, 2009
Sensitivity to inactivity threshold value RMS error= 1.8 % Threshold Fast/Slow= 10^2 mol/cm^3 sec CPU time= 53 % (Savings 47%) RMS error 10 2 10 Chemistry only CPU time 5 10 3 10 4 10 Mauricio Santillana- Harvard University 4th GEOS-Chem Scientific Meeting. April, 2009
Preliminary results GEOS-Chem: (Using a new solver to implement active/inactive selection) Original algorithm New algorithm Threshold active/inactive= 10^2 mol/cm^3 sec Approx. 30% Overall savings, 48% savings in Chemistry Mauricio Santillana- Harvard University 4th GEOS-Chem Scientific Meeting. April, 2009
Preliminary results: NOx (1 week run) Simulation date: July 8, 2004. 00Hrs GMT Mauricio Santillana- Harvard University 4th GEOS-Chem Scientific Meeting. April, 2009
Preliminary results: OH (1 week run) Simulation date: July 8, 2004. 00Hrs GMT Mauricio Santillana- Harvard University 4th GEOS-Chem Scientific Meeting. April, 2009
Future work: • 1 month running right now, • Goal: 1 year. • Implement spatial extrapolation (Rastigeyev, Y., M.P. Brenner, and D.J. Jacob, PNAS, 2007) Thank you Questions? Contact: msantill@fas.harvard.edu Mauricio Santillana- Harvard University 4th GEOS-Chem Scientific Meeting. April, 2009