Download
1 / 28
300 likes | 454 Views
Health Applications with GIS. Dr. (Mrs.) P. Venkatachalam IIT Bombay. History.

E N D
Health Applications with GIS Dr. (Mrs.) P. Venkatachalam IIT Bombay
History In a classic study undertaken in 1854, John Snow demonstrated the utility of mapping disease outbreaks to gain insights as to their cause. Snow, an anaesthesiologist, mapped the distribution of cholera cases in Soho, London during an epidemic. He discovered that the highest density of cases occurred in households, which used the public pump on Broad Street as their water source.
Categories of Applicationsrelated to Health GIS • Point based applications • Line based applications • Area based applications • Statistical Monitoring • Time series analysis • Temporal Cluster analysis • Spatio-temporal analytic techniques
Point based applications • As the name implies, also known as dot maps, attempt to display the distribution of health events as data locations • The ability to overlay data locations with other relevant spatial information is a general tool of considerable power • It is useful for delimiting areas of case occurrences, identification of contaminated environmental sources, visual inspection of spatial clusters, and analyzing health care resources distribution
Line based applications • Vectors or lines are graphic resources that aid in the analysis of disease diffusion and patient-to-health care facilities flow • In their simplest form, lines indicate the presence of flow or contagion between two subregions which may or may not be contiguous • Arrows with widths proportional to the volume of flow between areas are important tools to evaluate the health care needs of different locations • Use of line pattern analysis is quite common in epidemiology to describe the diffusion of several epidemics, such as the international spread of AIDS
Area based applications • The first stage of data analysis is to describe the available data sets through tables or one-dimensional graphics, such as the histogram • For spatial analysis, the obvious option is to present data on maps, with the variable of interest divided into classes or categories, and plotted using colours within each geographic unit
Statistical Monitoring • A common measure used by epidemiologists to identify increases in case occurrence of diseases, is the ratio of case numbers at a particular time to past case occurrence using the mean or median • A GIS allows mean and median calculations to be performed on non-spatial attribute data
Time Series Analysis • The common analytical framework uses time series models to forecast expected numbers of cases, followed by comparison with the actual observation • Detection of changes from historical patterns through forecast error uses the difference between the actual and estimated values at each point in time • In contrast to other monitoring schemes, time series methods use the correlation structure of the data at different time intervals in making estimates
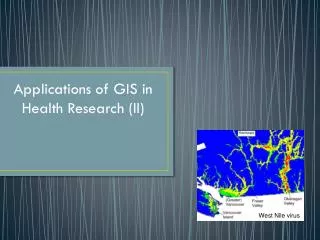
HIV/AIDS spread in Thailand changing from 1991-93 to 1994-96
Spatio-Temporal Analytic techniques • Space-time interaction among health events or between health events and environmental variables is an important component for epidemiological studies and public health surveillance • The bulk of the development in spatio-temporal patterns of health problems has been based on modeling and simulation because of the paucity of available data sets
Advantages • On the basic level, the GIS can provide map-based (“point and click”) access to view information about a particular feature, such as a district or facility • Advanced users can employ spatial analysis techniques to answer questions related to their health-sector concerns • GIS plays a critical role in determining where and when to intervene, improving the quality of care, increasing accessibility of service, finding more cost-effective delivery modes, and preserving patient confidentiality while satisfying the needs of the research community for data accessibility
Service Availability Mappingof HIV/AIDS in Maharashtra state
Project Objectives • Participation in preparation of questionnaire with TISS • Database design for storing primary survey data collected by TISS • Field visit to selected facilities • Creation of spatial database for district and tehsil level • Linking of spatial database with field survey data in GRAM++ GIS software • Generation of Interactive Maps • Training district level officials on use of GRAM++ in health applications • Training district level officials on use of handheld GPS/PDA