Download
1 / 26
290 likes | 468 Views
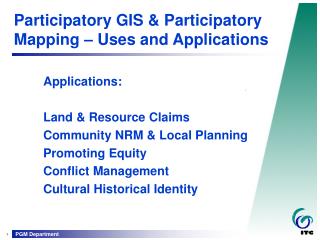
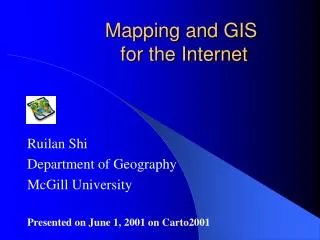
GIS and Mapping Applications. Pertemuan 7 Siswanto, dkk. What is a GIS and why use one?. GIS is seperangkat alat untuk mengumpulkan, menyimpan, memanggil, mentranformasi dan menampilkan data spasial dari kenyataan permukaan bumi untuk tujuan tertentu (Burrough and McDonnell, 1998)

E N D
GIS and Mapping Applications Pertemuan 7 Siswanto, dkk
What is a GIS and why use one? GIS is seperangkat alat untuk mengumpulkan, menyimpan, memanggil, mentranformasi dan menampilkan data spasial dari kenyataan permukaan bumi untuk tujuan tertentu (Burrough and McDonnell, 1998) GIS adalah system computerized untuk menangani hubungan data dan spasial (Mather, 1991)
Why use GIS? "A GIS links spatial data with geographic information about a particular feature on a map. The information is stored as attributes of the graphically represented feature.“ ESRI 1992 "With GIS it is possible to map, model, query, and analyse large quantities of data all held together within a single database." The Geographer Craft, 1992
Key definitions spatial data - data that can be linked in geographic space to some feature on a map - has both a spatial (where) and an attribute (what) component feature a single entity that comprises part of a landscape which can be represented as a point, line or polygon
Key definitions attribute a characteristic of a feature that contains a measurement or value for the feature - a column in a data file ‘Attribute’ information describes the data e.g. type of tree, length of road, name of settlement.
GIS components Attribute Database Manajement System GIS Spacial Analysis Tools Kit Mapping Package Point, line, areas feature layer route finding buffering polygon overlay
GIS and mapping applications mapping application - primary goal is the production of screen or hard-copy maps - enables map data to be transferred into a GIS - does not generally support topological data structures GIS - spatial data with spatial indexing and topology - analyse the interaction between different spatial entities - query data which has a spatial component or by spatial criteria - create new objects based on these interactions
GIS and mapping applications Topology is the term used to describe the way the spatial entities relate to each other i.e. where a point, line or area is located with respect to its neighbours. Topological data structures are used within a GIS to store informationabout the spatial data such as line networks, adjacent and island polygons.
Relationship of world and GIS Thematic data layers
Modelling the Real World. Object-Oriented (O-O) approach ‘object classes’ are used of layers (this was also introduced in Introduction to Digital Map data). Spatial Data Models. They are required in order to (i) model the structure and features of real world and (ii) to select an appropriate data structure to store the model within a computer. The two spatial data models are raster and vector. The two spatial data models are raster and vector.
Spatial data models (7,8) (4,3) (1,2) Vector data - all data within Digimap are vector data - points, lines and areas Raster data geographical regions divided into a regular grid of squares or grid cells
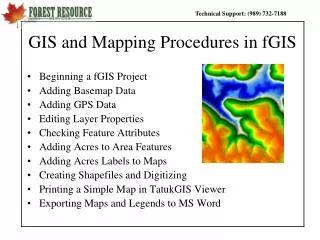
Key stages in using a GIS Data acquisition/tambahan data - Digimap and elsewhere/digitasi dan dari tempat lain - Data can be entered into a GIS in a variety of ways Data management Data management raises a series of important issues. Data analysis (Layer dan atribute) Data output produce a map or report
Data management • recall Data Downloading session • data formats - Spatial data - Attribute data database formats such as .DBF, Microsoft Access • data storage • data backup - essential to avoid loss of work • update procedure - synchronised with backup schedule
Data Analysis The analysis of data within a GIS allows users to derive information from those data. • analysis of data is the "turning data into information" part of the GIS • whole books have been devoted to spatial analysis • GIS analysis can be divided into three types: - single object analysis - multiple object analysis - analysis resulting in the creation of a new object
GIS analysis functions • general functions coordinate transformation, modify geometry / attributes of objects, information retrieval • analysis - single objects co-ordinate transformation, generalise or smooth lines • analysis - multiple objects measure distance, network analysis, compute statistics for a set of objects, combine datasets, intervisibility • analysis - create new objects overlay, dissolve and merge area objects
Information retrieval : Land-Line.Plus Click on a map feature to retrieve information
Information retrieval : Land-Line.Plus Measure distance between locations A and B B A
Analysis of multiple objects • Requires topologically structured data • Network analysis – Meridian: • shortest route • fastest route
Analysis creating new objects • Polygon overlay • Very important procedure of GIS analysis which involves superimposing 2 or more map layers to produce a new map layer • Used to answer Where is the best place? type of queries • Buffer analysis • Creation of a corridor around a main road thus enables the selection of services within a certain distance of the road • Visual analysis - buffer around a river based on flow volume to indicate varying discharge along a river’s course
Polygon overlay three main operations used for integrative overlay are Identity, Intersect and Union. The supplementary operations of Clip, Erase,Split and Update
Surface analysis - PANORAMA DEM View of the Lake District satellite imagery overlaid on a PANORAMA DEM Thanks to Dr. Jo Wood, University of Leicester
Buffer analysis Firstly it is possible to use buffers for purely visual output either for map production used for further queries on associated features.
Data output - map design • recall Cartographic Concepts in Module 1 • selection of features • symbolisation • Points (symbol/line style, colour and width) • lines • Areas boundary style, colour and width and fill style, colour and translucency/arsiran) • text portrayal (cara membawakan) • generalisation
Sources of digital data • mapping • Ordnance Survey from EDINA Digimap • Bartholomew from MIMAS • boundary data from EDINA • socio-economic • census from MIMAS and EDINA • lifestyle from commercial sources • postcode data • satellite: SPOT, Landsat from MIMAS • individual researcher sources