Download
1 / 23
230 likes | 236 Views
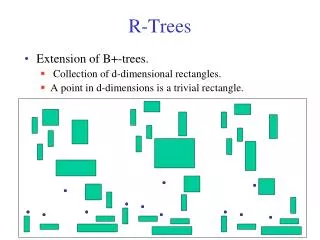
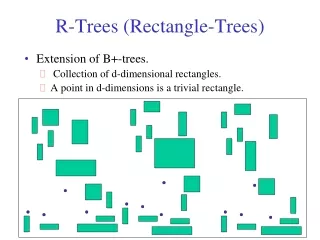
R-trees: An Average Case Analysis. R-trees - performance analysis. How many disk (=node) accesses we’ll need for range nn spatial joins why does it matter?. R-trees - performance analysis. A: because we can design split etc algorithms accordingly; also, do query-optimization

E N D
R-trees - performance analysis • How many disk (=node) accesses we’ll need for • range • nn • spatial joins • why does it matter?
R-trees - performance analysis • A: because we can design split etc algorithms accordingly; also, do query-optimization • motivating question: on, e.g., split, should we try to minimize the area (volume)? the perimeter? the overlap? or a weighted combination? why?
R-trees - performance analysis • How many disk accesses (expected value) for range queries? • query distribution wrt location? • “ “ wrt size?
R-trees - performance analysis • How many disk accesses for range queries? • query distribution wrt location? uniform; (biased) • “ “ wrt size? uniform
R-trees - performance analysis • easier case: we know the positions of data nodes and their MBRs, eg:
R-trees - performance analysis • How many times will P1 be retrieved (unif. queries)? x1 P1 x2
R-trees - performance analysis • How many times will P1 be retrieved (unif. POINT queries)? x1 1 P1 x2 0 0 1
R-trees - performance analysis • How many times will P1 be retrieved (unif. POINT queries)? A: x1*x2 x1 1 P1 x2 0 0 1
R-trees - performance analysis • How many times will P1 be retrieved (unif. queries of size q1xq2)? x1 1 P1 x2 q2 0 q1 0 1
R-trees - performance analysis • Minkowski sum q2 q1 q1/2 q2/2
R-trees - performance analysis • How many times will P1 be retrieved (unif. queries of size q1xq2)? A: (x1+q1)*(x2+q2) x1 1 P1 x2 q2 0 q1 0 1
R-trees - performance analysis • Thus, given a tree with n nodes (i=1, ... n) we expect
R-trees - performance analysis • Thus, given a tree with n nodes (i=1, ... n) we expect ‘volume’ ‘surface area’ count
R-trees - performance analysis Observations: • for point queries: only volume matters • for horizontal-line queries: (q2=0): vertical length matters • for large queries (q1, q2 >> 0): the count N matters • overlap: does not seem to matter (but it is related to area) • formula: easily extendible to n dimensions
R-trees - performance analysis Conclusions: • splits should try to minimize area and perimeter • ie., we want few, small, square-like parent MBRs • rule of thumb: shoot for queries with q1=q2 = 0.1 (or =0.05 or so).
More general Model • What if we have only the dataset D and the set of queries S? • We should “predict” the structures of a “good” R-tree for this dataset. Then use the previous model to estimate the average query performance for S • For point dataset, we can use the Fractal Dimension to find the “average” structure of the tree • (More in the [FK94] paper)
Unifrom dataset • Assume that the dataset (that contains only rectangles) is uniformly distributed in space. • Density of a set of N MBRs is the average number of MBRs that contain a given point in space. OR the total area covered by the MBRs over the area of the work space. • N boxes with average size s= (s1,s2), D(N,s) = N s1 s2 • If s1=s2=s, then:
Density of Leaf nodes • Assume a dataset of N rectangles. If the average page capacity is f, then we have Nln = N/f leaf nodes. • If D1 is the density of the leaf MBRs, and the average area of each leaf MBR is s2, then: • So, we can estimate s1, from N, f, D1 • We need to estimate D1 from the dataset’s density…
Estimating D1 Consider a leaf node that contains f MBRs. Then for each side of the leaf node MBR we have: MBRs Also, Nln leaf nodes contain N MBRs, uniformly distributed. The average distance between the centers of two consecutive MBRs is t= (assuming [0,1]2 space) t
Estimating D1 • Combining the previous observations we can estimate the density at the leaf level, from the density of the dataset: • We can apply the same ideas recursively to the other levels of the tree.
R-trees–performance analysis • Assuming Uniform distribution: where And D is the density of the dataset, f the fanout [TS96], N the number of objects
References • Christos Faloutsos and Ibrahim Kamel. “Beyond Uniformity and Independence: Analysis of R-trees Using the Concept of Fractal Dimension”. Proc. ACM PODS, 1994. • Yannis Theodoridis and Timos Sellis. “A Model for the Prediction of R-tree Performance”. Proc. ACM PODS, 1996.