Download
1 / 7
80 likes | 294 Views
Decision Trees in R. Arko Barman Slightly edited by Ch. Eick COSC 6335 Data Mining. Decision Trees. Used for classifying data by partitioning attribute space Tries to find axis-parallel decision boundaries for specified optimality criteria

E N D
Decision Trees in R ArkoBarman Slightly edited by Ch. Eick COSC 6335 Data Mining
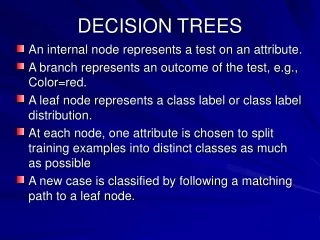
Decision Trees • Used for classifying data by partitioning attribute space • Tries to find axis-parallel decision boundaries for specified optimality criteria • Leaf nodes contain class labels, representing classification decisions • Keeps splitting nodes based on split criterion, such as GINI index, information gain or entropy • Pruning necessary to avoid overfitting
Decision Trees in R mydata<-data.frame(iris) attach(mydata) library(rpart) model<-rpart(Species ~ Sepal.Length + Sepal.Width + Petal.Length + Petal.Width, data=mydata, method="class") plot(model) text(model,use.n=TRUE,all=TRUE,cex=0.8)
Decision Trees in R library(tree) model1<-tree(Species ~ Sepal.Length + Sepal.Width + Petal.Length + Petal.Width, data=mydata, method="class", split="gini") plot(model1) text(model1,all=TRUE,cex=0.6)
Decision Trees in R library(party) model2<-ctree(Species ~ Sepal.Length + Sepal.Width + Petal.Length + Petal.Width, data=mydata) plot(model2)
Controlling number of nodes This is just an example. You can come up with better or more efficient methods! library(tree) model1<-tree(Species ~ Sepal.Length + Sepal.Width + Petal.Length + Petal.Width, data=mydata, method="class", control = tree.control(nobs = 150, mincut = 10)) plot(model1) text(model1,all=TRUE,cex=0.6) Note how the number of nodes is reduced by increasing the minimum number of observations in a child node!
Controlling number of nodes This is just an example. You can come up with better or more efficient methods! model2<-ctree(Species ~ Sepal.Length + Sepal.Width + Petal.Length + Petal.Width, data = mydata, controls = ctree_control(maxdepth=2)) plot(model2) Note that setting the maximum depth to 2 has reduced the number of nodes!