Download
1 / 1
10 likes | 188 Views
Tract-Based Spatial Statistics of Diffusion Tensor Imaging in Adult Dyslexia.

E N D
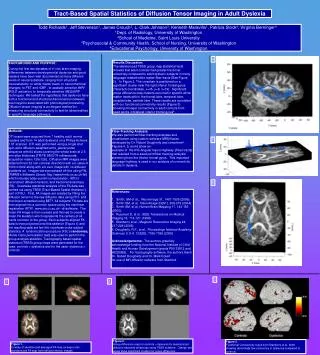
Tract-Based Spatial Statistics of Diffusion Tensor Imaging in Adult Dyslexia Todd Richards1, Jeff Stevenson1, James Crouch2, L. Clark Johnson3, Kenneth Maravilla1, Patricia Stock4, Virginia Berninger41Dept. of Radiology, University of Washington2School of Medicine, Saint Louis University3Psychosocial & Community Health, School of Nursing, University of Washington4Educational Psychology, University of Washington 4 Results/Discussion: The skeletonized TBSS group map statistical tests showed that adult controls had greater fractional anisotropy compared to adult dyslexic subjects in many language-related white matter fiber tracts (See Figure 2). In Figure 2, The crosshair is positioned on a significant cluster near the right inferior frontal gyrus (Talairach coordinates, x=45, y=8, z=19) . Significant group difference map clusters occurred in specific white matter tracts within the frontal lobe, temporal lobe, occipital lobe, parietal lobe. These results are consistent with our functional connectivity results (Figure 3) showing stronger connectivity in adult controls from seed points in bilateral inferior frontal gyrus5 . BACKGROUND AND PURPOSE: During the first two decades of in vivo brain imaging, differences between developmental dyslexics and good readers have been well documented at many different levels of neural substrate, ranging from structural neuroanatomy to white matter tracts, to neurochemical changes, to PET and rCBF , to spatially sensitivefMRI BOLD activation, to temporally sensitive MEG/ERP techniques.We tested the hypothesis that dyslexics have both a functional and structural disconnection between brain regions associated with phonological processing. Diffusion tensor imaging is an elegant method for measuring structural connectivity to test for abnormalities in specific language pathways. Methods: DTI scans were acquired from 7 healthy adult normal readers and from 14 adult dyslexics on a Philips Achieva 1.5T scanner. DTI was performed using a single shot spin-echo diffusion-weighted echo_planar pulse sequence with 64 slices covering the whole brain at 2.5 mm slice thickness (TR/TE 9500/74 milliseconds; acquisition matrix 128x128). Diffusion MRI images were obtained from 32 non-colinear directions with a b value of 1000 s/mm2 along with a b zero image with no diffusion gradients on. Images were processed off-line using FSL (FMRIB's Software Library, http://www.fmrib.ox.ac.uk/fsl) which includes eddy-current compensation, dtifit to reconstruct diffusion tensors, and fractional anisotropy (FA). Voxelwise statistical analysis of the FA data was carried out using TBSS (Tract-Based Spatial Statistics1), part of FSL2. First, FA images are created by fitting the diffusion tensor to the raw diffusion data using FDT, and then brain-extracted using BET3. All subjects' FA data are then aligned into a common space using the nonlinear registration IRTK4, www.doc.ic.ac.uk/~dr/software. The mean FA image is then created and thinned to create a mean FA skeleton which represents the centers of all tracts common to the group. Each subject's aligned FA data is then projected onto this skeleton (Figure 1) and the resulting data are fed into voxelwise cross-subject statistics. A randomization procedure (FSL's randomise, Monte Carlo permutation test) was used to perform the group analysis statistics. Tractography based spatial statistical (TBSS) group maps were generated for the case: controls > dyslexics and for the case- dyslexics > controls. Fiber-Tracking Analysis: We also performed fiber-tracking analyses and visualization using custom software MRDiffusion developed by Dr. Robert Dougherty and coworkers6 . Figures 4, 5, and 6 show an example of the IFG-Angular Gyrus Highway (Fiber tracts) that resulted from a seed point/fiber tracking analysis stemming from the inferior frontal gyrus. This important language highway is used in our analysis of connectivity deficits in dyslexia. 5 6 References: 1. Smith, SM et al.,. Neuroimage 31, 1487-1505 (2006).2. Smith SM, et al, NeuroImage 23(S1), 208-219 (2004).3. Smith SM, et al, Human Brain Mapping 17, 143-155 (2002). 4. Rueckert D, et al., IEEE Transactions on Medical Imaging 18, 712-721 (1999) .5. Stanberry et al., Magnetic Resonance Imaging 24, 217-229 (2006). 6. Dougherty, R,F., et al., Proceedings National Academy Sciences U S A, 102(20), 7350-7355 (2005) Acknowledgements: The authors gratefully acknowledge funding from the National Institute of Child Health and Human Development (grants P50 33812 and HD25858). For tractography software, the authors thank Dr. Robert Dougherty and Dr. Mark Eckert for use of MR diffusion software from Stanford. 3 2 1 Figure 2. Group difference map for controls > dyslexics for skeletonized diffusion fractional anisotropy using TBSS software. Orange-red areas show significant clusters for group difference. Figure 3. Functional Connectivity result from Stanberry et al. 2006 showing abnormally low connectivy in dyslexics compared to controls. Figure 1. Overlay of skeletonized averaged FA map (orange) onto standardized FA map from diffusion tensor images.