Download
1 / 1
10 likes | 224 Views
Evaluation of Multi-Center Diffusion Tensor Imaging. VA Magnotta 1 , GS Bonett 1 , J Turner 6 , B Mueller 2 , A Juhl 1 , K Lim 2 , S Reading 3 , E Aylward 5 , M Lowe 4 , L Flashman 7 , B Bolster 8 , S Mori 2 , K Helmer 9 , JS Paulsen 1

E N D
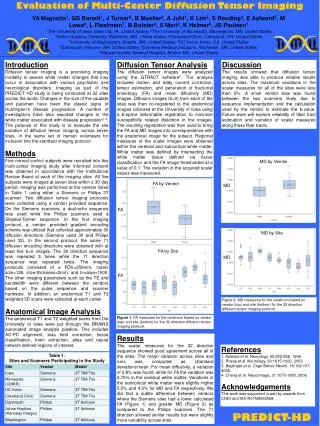
Evaluation of Multi-Center Diffusion Tensor Imaging VA Magnotta1, GS Bonett1, J Turner6, B Mueller2, A Juhl1, K Lim2, S Reading3, E Aylward5, M Lowe4, L Flashman7, B Bolster8, S Mori2, K Helmer9, JS Paulsen1 1The University of Iowa, Iowa City, IA, United States; 2The University of Minnesota, Minneapolis, MN, United States 3Johns Hopkins University, Baltimore, MD, United States; 4Cleveland Clinic, Cleveland, OH, United States 5University of Washington, Seattle, WA, United States; 6UC Irvine, Irvine, CA, United States 7Dartmouth, Hanover, NH, United States; 8Siemens Medical Solutions, Rochester, MN, United States; 9Massachusetts General Hospital, Boston MA, United States Introduction Diffusion tensor imaging is a promising imaging modality to assess white matter changes that may occur in association with various psychiatric and neurological disorders. Imaging as part of the PREDICT HD study is being conducted at 32 sites across the world. Changes in the size of the caudate and putamen have been the classic signs of Huntington's disease progression. A number of investigators have also reported changes in the white matter associated with disease progression1-3. The purpose of this study is to evaluate the site variation of diffusion tensor imaging, across seven sites, in the same set of human volunteers for inclusion into the standard imaging protocol. Methods Five normal control subjects were recruited into this multi-center imaging study after informed consent was obtained in accordance with the Institutional Review Board at each of the imaging sites. All five subjects were imaged at seven sites within a 30 day period. Imaging was performed at the centers listed in Table 1 using either a Siemens or Philips 3T scanner. Two diffusion tensor imaging protocols were collected using a vendor provided sequence. On the Siemens scanners, a dual-echo sequence was used while the Philips scanners used a Stejskal-Tanner sequence. In the first imaging protocol, a vendor provided gradient encoding scheme was utilized that collected approximately 30 diffusion directions (Siemens used 30 and Philips used 32). In the second protocol, the same 71 diffusion encoding directions were obtained with at least five b=0 images. The 30 direction sequence was repeated 3 times while the 71 direction sequence was repeated twice. The imaging protocols consisted of a FOV=256mm, matrix size=128, slice-thickness=2mm, and b-value=1000. The other imaging parameters such as the TE and bandwidth were different between the vendors based on the pulse sequence and scanner hardware. In addition, an anatomical T1 and T2 weighted 3D scans were collected at each center. Anatomical Image Analysis The anatomical T1 and T2 weighted scans from the University of Iowa were put through the BRAINS automated image analysis pipeline. This includes AC-PC alignment, bias field correction, tissue classification, brain extraction, atlas and neural network defined regions of interest. Diffusion Tensor Analysis The diffusion tensor images were analyzed using the GTRACT software4. The analysis included motion and eddy current correction, tensor estimation, and generation of fractional anisotropy (FA) and mean diffusivity (MD) images. Diffusion images (b=0) from each of the sites was then co-registered to the anatomical images collected at the University of Iowa using a b-spline deformable registration to minimize susceptibility related distortion in the images. The resulting registration was then used to bring the FA and MD images into correspondence with the anatomical image for the subject. Regional measures of the scalar images were obtained within the cerebral and subcortical white matter. White matter was defined by intersecting the white matter tissue defined via tissue classification and the FA image thresholded at a value of 0.1. The variation in the acquired scalar values was measured. Discussion The results showed that diffusion tensor imaging was able to produce reliable results across sites. The maximum variations in the scalar measures for all of the sites were less than 6%. A small vendor bias was found between the two scanners likely due to sequence implementation and the calculation used by the vendor to estimate the b-value. Future work will explore reliability of fiber tract estimation and variation of scalar measures along these fiber tracts. MD by Site MD FA by Vendor FA MD by Vendor MD FA by Site FA Figure 2. MD measures for the cerebrum based on vendor (top) and site (bottom) for the 32 direction diffusion tensor imaging protocol. Figure 1. FA measures for the cerebrum based on vendor (top) and site (bottom) for the 32 direction diffusion tensor imaging protocol. Results The scalar measures for the 32 direction sequence showed good agreement across all of the sites. The mean variation across sites and runs was computed as (standard deviation)/mean. For mean diffusivity, a variation of 2.8% was found, while for FA the variation was 2.75% in the cerebral white matter. Variations in the subcortical white matter were slightly higher 5.5% and 4.3% for MD and FA respectively. We did find a subtle difference between vendors where the Siemens sites had a lower calculated FA (Figure 1) and greater MD (Figure 2) as compared to the Philips scanners. The 71 direction showed similar results but were slightly more variability across sites. References 1. Aylward et al. Neurology, 50:252-258, 1998 2. Rosas et al. Neurology, 60:1615-1620, 2003 3. Beglinger et al. Cogn Behav Neurol, 18:102-107, 2005. 4. Cheng et al. Neuroimage, 31:1075-1085, 2006 Acknowledgements This work was supported in part by awards from CHDI and NIH R01NS050568. Table 1. Sites and Scanners Participating in the Study PREDICT-HD