Download
1 / 16
170 likes | 504 Views
Graphs, Variables, and Economic Models. A quantity that can take on more than one value is called a variable . Appendix. Two-Variable Graphs. How Graphs Work. Appendix. Two-Variable Graphs. How Graphs Work.

E N D
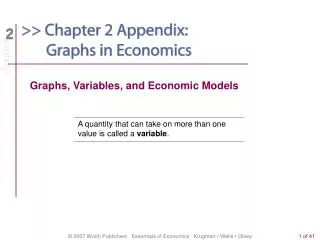
Graphs, Variables, and Economic Models A quantity that can take on more than one value is called a variable.
Appendix Two-Variable Graphs • How Graphs Work
Appendix Two-Variable Graphs • How Graphs Work The line along which values of the x-variable are measured is called the horizontal axis or x-axis. The line along which values of the y-variable are measured is called the vertical axis ory-axis. The point where the axes of a two-variable graph meet is the origin. A causal relationship exists between two variables when the value taken by one variable directly influences or determines the value taken by the other variable. In a causal relationship, the determining variable is called the independent variable; the variable it determines is called the dependent variable.
Appendix Curves on a Graph • How Graphs Work
Appendix Curves on a Graph • How Graphs Work A curve is a line on a graph that depicts a relationship between two variables. It may be either a straight line or a curved line. If the curve is a straight line, the variables have a linear relationship. If the curve is not a straight line, the variables have a nonlinear relationship.
Appendix Curves on a Graph • How Graphs Work Two variables have a positive relationship when an increase in the value of one variable is associated with an increase in the value of the other variable. It is illustrated by a curve that slopes upward from left to right. Two variables have a negative relationship when an increase in the value of one variable is associated with a decrease in the value of the other variable. It is illustrated by a curve that slopes downward from left to right. The horizontal intercept of a curve is the point at which it hits the horizontal axis; it indicates the value of the x-variable when the value of the y-variable is zero. The vertical intercept of a curve is the point at which it hits the vertical axis; it shows the value of the y-variable when the value of the x-variable is zero.
Appendix • A Key Concept: The Slope of a Curve The slope of a line or curve is a measure of how steep it is. The slope of a line is measured by “rise over run”—the change in the y-variable between two points on the line divided by the change in the x-variable between those same two points. The Slope of a Linear Curve
Appendix The Slope of a Linear Curve • A Key Concept: The Slope of a Curve
Appendix Horizontal and Vertical Curves and Their Slopes • A Key Concept: The Slope of a Curve When a curve is horizontal, the value of y along that curve never changes—it is constant. The slope of a horizontal curve is always zero. If a curve is vertical, the value of x along the curve never changes—it is constant. The slope of a vertical line is equal to infinity. A vertical or a horizontal curve has a special implication: it means that the x-variable and the y-variable are unrelated.
Appendix The Slope of a Nonlinear Curve • A Key Concept: The Slope of a Curve A nonlinear curve is one in which the slope is not the same between every pair of points. The absolute value of a negative number is the value of the negative number without the minus sign.
Appendix The Slope of a Nonlinear Curve • A Key Concept: The Slope of a Curve
Appendix The Slope of a Nonlinear Curve • A Key Concept: The Slope of a Curve
Appendix Calculating the Slope Along a Nonlinear Curve • A Key Concept: The Slope of a Curve To calculate the slope along a nonlinear curve, you draw a straight line between two points of the curve. The slope of that straight line is a measure of the average slope of the curve between those two end-points.
Appendix Maximum and Minimum Points • A Key Concept: The Slope of a Curve A nonlinear curve may have a maximum point, the highest point along the curve. At the maximum, the slope of the curve changes from positive to negative. A nonlinear curve may have a minimum point, the lowest point along the curve. At the minimum, the slope of the curve changes from negative to positive.
Appendix Maximum and Minimum Points • A Key Concept: The Slope of a Curve
Nonlinear Relationships (A) Decreasing positive slope (B) Increasing positive slope X X Y Y (C) Decreasing negative slope (D) Increasing negative slope Y Y