Download
1 / 12
120 likes | 140 Views
Explore distance, velocity, acceleration, and motion models in physics with examples and equations. Understand how to interpret motion graphs for a deeper comprehension.

E N D
Motion Variables and Models Or “We’ve got to keep on moving”
Variables that measure how far? Distance Displacement Position change w/ regard to direction Vector quantity Same units as distance Dx = Xf – Xi • Absolute position change w/o regard to direction • Scalar quantity • Measured in meters, feet, miles • D or s Positive means moves to right, negative to left
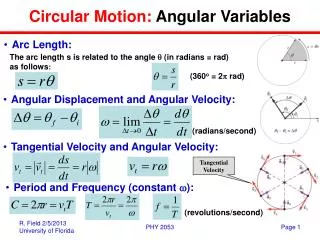
Variables that measure how fast? Speed Velocity Displacement /time interval w/ regard to direction Vector Same units as speed Vavg =(Xf – Xi) / (tf –ti) =Dx/Dt • Distance moved/time to move distance w/o regard to direction • Scalar • Measured in m/s, miles/hr, ft/s Positive means moving to right, negative to left
Instantaneous vs. Average Quantities • Instantaneous quantities occur at a single clock reading. • Only one speed • Often slope of tangent line to curve on graph • Average quantities occur over several clock readings or a interval of time. • Object may have several speeds during interval • Often slope of chord on graph • Examples: Average speed and position, Instantaneous speed and position
Variables Measuring How fast, fast changes • Acceleration • How fast an object speeds up, slows down, or changes direction • Measured in m/s/s, m/s2, km/hr/s etc. • A=(vf – vi) / (tf – ti) = Dv / Dt • Positive means direction is to right, negative to left NOT that acceleration is increasing or decreasing • Instantaneous Acceleration is acceleration at one moment in time
Motion Models Constant Velocity Constant Acceleration Object moves increasing or decreasing distances each second Fab 4 Equations Dx=v0 Dt +1/2 aDt2 Vf=V0+aDt Vf2 = V02 +2aDx Dx=((Vf + V0) /2) Dt X-t graph is parabola V-t graph is line Examples: car speeding up or slowing down • Object moves equal distance each second • Dx=v Dt • X-t graph is line, slope is velocity • V-t graph is horizontal line • Example: car moving at one speed
Motion Graph Interpretations • For X-t graphs • Slope over time interval is the average velocity • Slope of tangent line is the instantaneous velocity • For V-t graphs • Slope over time interval is the average acceleration (slope of chord of graph) • Slope of tangent line is instantaneous acceleration • Area under curve is displacement (can be + or -) • Examples
Lecture 3 Question 1 • A runner takes 4 laps around a 400 m oval track. What are the distance and displacement the runner runs? • 1600 m, 1600 m • 0 m, 1600 m • 1600 m, 0 m • 0 m, 0 m
Lecture 3 Question 2 • A confused physics professor paces 20 m in one direction in 5 seconds and then 10 m in the opposite direction in 10 seconds. What is the magnitude of the average velocity of the professor? • 1 m/s • 2 m/s • 3 m/s • 4 m/s
Lecture 3 Question 3 • What is the acceleration of a car that goes from 20 mph to 100 mph in 4 seconds? • 5 mph/s • 20 mph/s • 25 mph/s • 30 mph /s
Lecture 3 Question 4 • Which of the following describes the graphs of a car with a constant acceleration? • V-t and X-t graphs are straight lines • V-t and X-t graphs are curves • V-t graph is straight line, X-t graph is a parabola • V-t graph is horizontal line, X-t graph is straight line
Lecture 3 Question 5 • What do the slope and area under a velocity time graph represent? • Acceleration and velocity • Velocity and displacement • Acceleration and displacement • Displacement and velocity