Download
1 / 17
170 likes | 307 Views
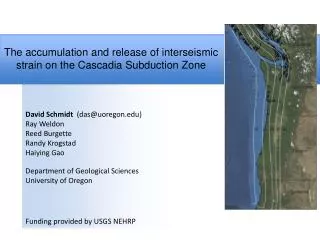
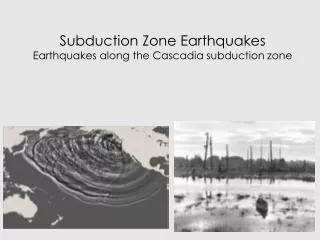
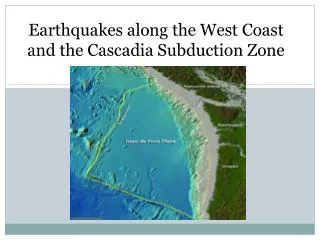
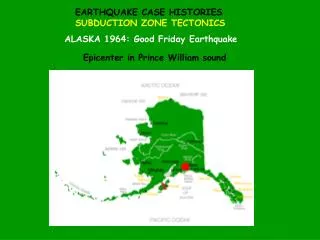
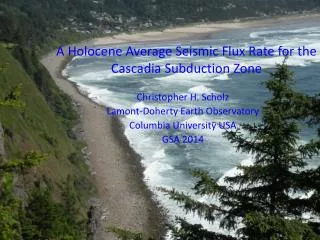
A Holocene Average Seismic Flux Rate for the Cascadia Subduction Zone. Christopher H. Scholz Lamont-Doherty Earth Observatory Columbia University USA GSA 2014. Goldfinger et al. 2012 produced a space-time diagram Describing the history of great Cascadia subduction

E N D
A Holocene Average Seismic Flux Rate for the Cascadia Subduction Zone Christopher H. Scholz Lamont-Doherty Earth Observatory Columbia University USA GSA 2014
Goldfinger et al. 2012 produced a space-time diagram Describing the history of great Cascadia subduction earthquakes over the Holocene. This represents the longest and purportedly most complete record of seismicity available for any plate Boundary. In an earlier study (Scholz and Campos, 2012) we had concluded that Cascadia was fully seismically coupled, In agreement with an earlier theory of the seismic coupling of subduction zones (Scholz and Campos, 1995). I therefore undertook to test whether this history met The most basic of tests: did the sum of slip deduced From this earthquake history match the Holocene plate Convergence as derived independently from plate Tectonics models?
Goldfinger et al. (2012) presented a Holocene history of large earthquakes in Cascadia. It showed a ramifying pattern in which progressively more earthquakes occur towards the south. Can this history be quantitatively in agreement with the convergence between the Juan de Fuca and North American plates?
The generally accepted model for plate convergence in Cascadia indicates lesser convergence rates to the south, which seems to conflict with the history of more subduction earthquakes in the south. Convergence model based on Nuvel 1A, corrected for forearc rotation (Wells and Simpson, 2001), as given by Wang et al. (2003) (Wang et al. 2003)
The dip of the subduction interface increases to the south, and thus the width of the coupled area decreases to the south. This turns out to be the key. Hyndman and Wang 95 thermal model
Scaling area to Moment I use a simple scaling law for seismic moment and rupture area S (Kanamori and Anderson, 1975) M0=kS3/2 Which I calibrate with the 1700 earthquake, which Satake et al.(2003) estimated to be Mw 9.0 and to have ruptured the entire length of the subduction zone, i.e., it was an A type event. With the model value for S, I obtain k=2.5x10¹⁵. Using this value of k, I obtain magnitudes for the B, C, and D type ruptures of Mw 8.7, 8.5, and 8.3, respectively.
Constant stress-drop assumption Stress-drop is assumed constant in all sectors: this is required because stresses must remain within narrow limits over many earthquake cycles. Because stress drop is related to segment width, slip must decrease to the south in each earthquake. To calculate slip in each segment, S1-S4, for a type A eqk, we thus use and solve for Du1, then etc, and continue for rupture types B-D.
As an example, these calculations indicate for the prototypical type A earthquake, the slip would be: Segment 1: 20 m segment 2: 14 m segment 3: 10 m segment 4: 8 m These slips may vary between different type A earthquakes, but have this same pattern
Wang et al (2013)
Conclusion • The Goldfinger et al. history is consistent with Holocene plate convergence. The number of type A events (entire plate boundary ruptures) must be approximately correct 19 ± 1. • The pattern of increased numbers of shorter earthquakes to the south is required by the decrease in width of the coupled area to the south and hence the reduction in slip per earthquake to the south. • Cascadia is fully seismically coupled with a Holocene average seismic flux rate of 2.7x10⁹ m3/yr.
While this simple model does agree with the overall behavior of Cascadia during the Holocene, it is oversimplified. Each earthquake in each segment must not be identical. For one thing, the temporal history does not follow any simple recurrence pattern, but shows clustering, with recurrence intervals of a few hundred years followed by long hiatuses (Hagstrom et al, 2004; Kelsey et al. 2005; Goldfinger, 2012). Similarly, Goldfinger et al. 2012 found large variations in the volumes of turbidites, suggesting different moment releases for the same class of earthquakes. This part of the puzzle remains to be solved.
“An entertaining and informative top-to-bottom peek at the clash between science and politics.” Kirkus Reviews “Stick-Slip” is Available at Amazon.com or Barnesandnoble.com