On Computing the Underlying Fiber Directions from the Diffusion Orientation Distribution Function
210 likes | 514 Views
On Computing the Underlying Fiber Directions from the Diffusion Orientation Distribution Function. Luke Bloy 1 , Ragini Verma 2 The Section of Biomedical Image Analysis University of Pennsylvania Department of Bioengineering 1 Department of Radiology 2. Diffusion Tensor Imaging.

On Computing the Underlying Fiber Directions from the Diffusion Orientation Distribution Function
E N D
Presentation Transcript
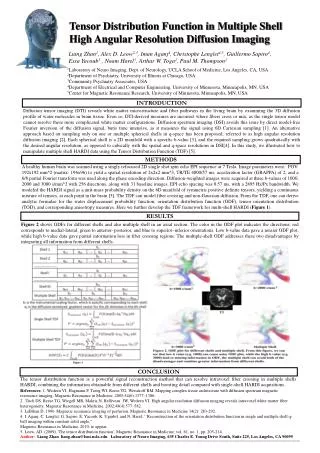
On Computing the Underlying Fiber Directions from the Diffusion Orientation Distribution Function Luke Bloy1, Ragini Verma2 The Section of Biomedical Image Analysis University of Pennsylvania Department of Bioengineering1 Department of Radiology2
Diffusion Tensor Imaging Diffusion imaging rests on the assumption that the diffusion process correlates with the underlying tissue structure. DTI model is incapable of representing multiple orientations
Diffusion Orientation Distribution Function ODF: Approximates the radial projection of the diffusion propagator. It essentially describes the probability that a water molecule will diffuse in a certain direction. Its maxima have been shown to correspond with principle directions of the underlying diffusion process.
Existing Methods: Optimization Methods Spherical Newton’s method Powell’s method Need to ensure convergence Need to avoid small local maxima Finite Difference Method Accuracy is limited by Mesh Size (accuracy of 4 degrees requires 1280 mesh points How to find the maxima of Orientation Distribution Function? NEEDS REFS
Computing Maxima of the Diffusion Orientation Distribution Function • Our method: • Represent ODF as symmetric Cartesian tensor • Compute the stationary points of the ODF from a system of • polynomial equations • Classify the stationary points using the local curvature • of the ODF graph into principle directions, secondary maxima, • minima and inflection points.
Equivalence of Real Spherical Harmonic Expansion and Symmetric Cartesian Tensors Real Spherical Harmonics Real Symmetric Spherical Functions Real Symmetric Cartesian Tensors
Orientation Distribution Function as a Cartesian Tensor In spherical coordinates the from of Funk-Radon transform allows a the computation of the ODF RSH expansion in terms of the RSH expansion of the MRI signal. Since M is a change of basis matrix it is invertible and the ODF tensor can be computed
t is a solution to an lth order polynomial Use the method of resultants to solve for v and u. Stationary points Stationary points are points on the sphere ( ) where the derivative of the ODF vanishes. Using the tensor representation of the ODF, they are solutions to the following system of equations.
Classification of Stationary Points Use the principle curvatures (k1, k2) to classify each stationary point: Inflection Points Minima Principle Directions Secondary Maxima
Stationary points of the Orientation Distribution Function One Fiber Two Fibers Three Fibers Diffusion ODF reconstructions from simulated fiber populations performed with a rank 4 tensor. Red lines indicate principle directions, Blue minima, Black lines saddle points and green lines indicate secondary maxima.
Angular Error = Affect of Signal to Noise on Principle Direction Calculation Single Tensor Model b = 3000 sec /cm2 64 gradient direction 50 DWI signals, each with randomly chosen principle direction, at each SNR SNR: 5,10,15,25,35,45
Application to Clinically Feasible Data 3Tesla scanner 64 Gradient Directions Single average Scan time ~ 8 min B = 1000 sec /cm2 CC : Corpus Collosum SCR : Superior Corona Radiata ALIC : Anterior Limb of the Internal Capsule
Implementation within fiber tracking framework Investigation of geometric features (mean curvature/Gauss curvature) of the ODF surface as measures of diffusion anisotropy Thanks… Future Work
Single Fibers Multiple Fibers Limitations of Diffusion Tensor Imaging DTI model is incapable of representing multiple orientations As many as 1/3 of white Matter voxels may be effected . Behrens et al, Neuroimage, 34 (1) 2007
Real Spherical Harmonics of Even Order Images of the first few?
Symmetric Cartesian Tensors Ref Max.
Relationship between Anisotropy and Mean Curvature Single tensor model mean diffusivity of 700 mm2/sec SNR = 35 Red line = absence of noise
Equivalence of Real Spherical Harmonic Expansion and Symmetric Cartesian Tensors Real Symmetric Spherical Functions Real Symmetric Cartesian Tensors Real Spherical Harmonics