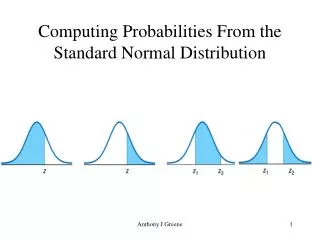
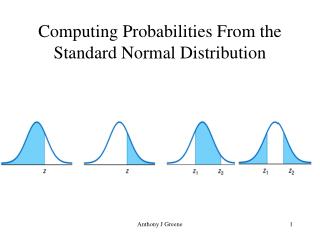
Computing Probabilities From the Standard Normal Distribution
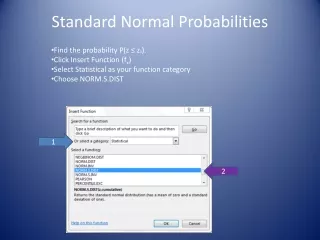
Computing Probabilities From the Standard Normal Distribution. Table B.1 p. 687. Table B.1 A Closer Look. The Normal Distribution: why use a table?. From x or z to P To determine a percentage or probability for a normally distributed variable .

Computing Probabilities From the Standard Normal Distribution
E N D
Presentation Transcript
Computing Probabilities From the Standard Normal Distribution Anthony J Greene
Table B.1A Closer Look Anthony J Greene
The Normal Distribution: why use a table? Anthony J Greene
From x or z to PTo determine a percentage orprobability for a normally distributed variable Step 1 Sketch the normal curve associated with the variable Step 2 Shade the region of interest and mark the delimiting x-values Step 3 Compute the z-scores for the delimiting x-values found in Step 2 Step 4 Use Table B.1 to obtain the area under the standard normal curve delimited by the z-scores found in Step 3Use Geometry and remember that the total area under the curve is always 1.00. Anthony J Greene
From x or z to PFinding percentages for a normally distributed variable from areas under the standard normal curve Anthony J Greene
Finding percentages for a normally distributed variable from areas under the standard normal curve • , are given. • a and b are any two values of the variable x. • Compute z-scores for a and b. • Consult table B-1 • Use geometry to find desired area. Anthony J Greene
Given that a quiz has a mean score of 14 and an s.d. of 3, what proportion of the class will score between 9 & 16? • = 14 and = 3. • a = 9 and b = 16. • za = -5/3 = -1.67, zb = 2/5 = 0.4. • In table B.1, we see that the area to the left of a is 0.0475 and that the area to the right of b is 0.3446. • The area between a and b is therefore 1 – (0.0475 + 0.3446) = 0.6079 or 60.79% Anthony J Greene
Finding the area under the standard normal curve to the left of z = 1.23 Anthony J Greene
What if you start with x instead of z? What is the probability of selecting a random student who scored above 650 on the SAT? z = 1.50: Use Column C; P = 0.0668 Anthony J Greene
Finding the area under the standard normal curve to the right of z = 0.76 The easiest way would be to use Column C, but lets use Column B instead Anthony J Greene
Finding the area under the standard normal curve that lies between z = –0.68 and z = 1.82 P = 1 – 0.0344 – 0.2483 = 0.7173 One Strategy: Start with the area to the left of 1.82, then subtract the area to the right of -0.68. Second Strategy: Start with 1.00 and subtract off the two tails Anthony J Greene
Determination of the percentage of people having IQs between 115 and 140 Anthony J Greene
From x or z to PReview of Table B.1 thus far • Using Table B.1 to find the area under the standard normal curve that lies • to the left of a specified z-score, • to the right of a specified z-score, • between two specified z-scores Then if x is asked for, convert from z to x Anthony J Greene
From P to z or xNow the other way aroundTo determine the observations corresponding to a specified percentage or probability for a normally distributed variable Step 1 Sketch the normal curve associated the the variable Step 2 Shade the region of interest (given as a probability or area Step 3 Use Table B.1 to obtain the z-scores delimiting the region in Step 2 Step 4 Obtain the x-values having the z-scores found in Step 3 Anthony J Greene
From P to z or xFinding z- or x-scores corresponding to a given region. Finding the z-score having area 0.04 to its left x = σ× z + μ If μ is 242 σ is 100, thenx = 100 × -1.75 + 242 x = 67 Use Column C: The z corresponding to 0.04 in the left tail is -1.75 Anthony J Greene
The zNotation The symbol zα is used to denote the z-score having area α (alpha) to its right under the standard normal curve. We read “zα” as “z sub α” or more simply as “zα.” Anthony J Greene
The z notation : P(X>x) = α P(X>x)= α This is the z-score that demarks an area under the curve with P(X>x)= α Anthony J Greene
The z notation : P(X<x) = α P(X<x)= α Z This is the z-score that demarks an area under the curve with P(X<x)= α Anthony J Greene
The z notation : P(|X|>|x|) = α P(|X|>|x|)= α α/2 α/2 1- α This is the z-score that demarks an area under the curve with P(|X|>|x|)= α Anthony J Greene
Finding z0.025 Use Column C: The z corresponding to 0.025 in the right tail is 1.96 Anthony J Greene
Finding z0.05 Use Column C: The z corresponding to 0.05 in the right tail is 1.64 Anthony J Greene
Finding the two z-scores dividing the area under the standard normal curve into a middle 0.95 area and two outside 0.025 areas Use Column C: The z corresponding to 0.025 in both tails is ±1.96 Anthony J Greene
Finding the 90th percentile for IQs z0.10 = 1.28 z = (x-μ)/σ 1.28 = (x – 100)/16 120.48 = x Anthony J Greene
What you should be able to do • Start with z-or x-scores and compute regions • Start with regions and compute z- or x-scores Anthony J Greene