Download
1 / 18
180 likes | 344 Views
We processed six samples in triplicate using 11 different array platforms at one or two laboratories. we obtained measures of array signal variability based on raw data before CNV calling.

E N D
We processed six samples in triplicate using 11 different array platforms at one or two laboratories. • we obtained measures of array signal variability based on raw data before CNV calling. • the data sets were analyzed with one or more CNV calling algorithms to determine the number of calls, between-replicate reproducibility and size distribution. • we compared the CNV calls to well-characterized and validated sets of variants, in order to examine the propensity for false-positive and false-negative calls and to estimate the accuracy of CNV boundaries.
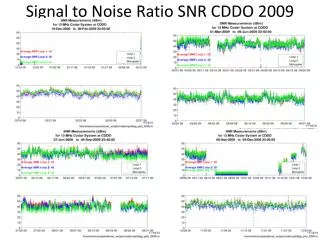
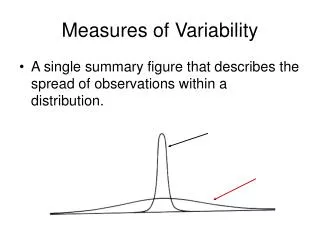
Measures of array variability and signal-to-noise ratio • The derivative log2 ratio spread statistic describes the absolute value of the log2 ratio variance from each probe to the next, averaged over the entire genome. • The interquartile range is a measure of the dispersion of intensities in the center of the distribution, and is therefore less sensitive to outliers.
The data show a correlation between probe-length and variability, with longer probes giving less variance in fluorescence intensity. • for Affymetrix results, we found large differences in quality control values depending on the baseline reference library used. • CGH arrays generally show better signal-to-noise ratios compared to SNP arrays, probably as a consequence of longer probes on the former platform. • Older arrays tend to perform less well than newer arrays from the same producer. • For the Affymetrix 500K platform, experiments performed for the 250K Sty assay failed quality control.
CNV calling • The platforms with higher resolution, as well as those specifically designed for detection of previously annotated CNVs, identified substantially higher numbers of variants compared to lower resolution arrays. • arrays that specifically target CNVs detected in previous studies (e.g., Illumina 660W) have a very uniform distribution of number of probes per CNV call compared to arrays such as Illumina 1M and Affymetrix 6.0. • Another aspect of the CNV calls that differ widely between platforms is the ratio of copy number gains to losses. Certain arrays are very biased toward detection of deletions, with the Illumina 660W showing the highest ratio of deletions to duplications. • For platforms with a higher resolution, a lower proportion of CNVs overlap genes
Between-replicate CNV reproducibility • A CNV call was considered replicated if there was a reciprocal overlap of at least 80% between CNVs in a pair-wise comparison. • Reproducibility was measured by calculating the sample level Jaccard similarity coefficient. • The reproducibility is found to be <70% for most platform and algorithm combinations. • In general, the most recently released arrays perform better, resulting in more CNV calls reproducibly obtained between replicates.
We observed that the variability in CNV calls was larger when using different CNV calling algorithms on the same raw data, compared to when the same algorithm is used on the data from different laboratories. • We find that results originating from different laboratories tend to cluster together, indicating that the site where the experiment was performed has less effect on resulting data than the choice of platform or algorithm. • Interlaboratory variability correlates with reproducibility, and platforms exhibiting high reproducibility in replicates also seem more robust to interlaboratory variability. The exceptions to this are the Affymetrix arrays, where CNV calls are highly dependent on the reference data set used for analysis. • We observe that the sample-level concordance of CNV calls between any combinations of two algorithms is typically 25–50% within a platform, and even lower for comparisons across platforms
reproducibility is generally similar for large (>50kb) and small CNVs (1-50kb). • We note that the reproducibility of large CNV calls is disproportionally affected by genome complexity as they tend to overlap SegDups to a larger extent than small CNVs. • the fraction of calls missed by each platform (of the regions detected by at least two other arrays), ranges from 15% for Agilent 2×244K to ~73–77% for Illumina SNP arrays. These differences between platforms may to some extent be explained by overlap with SegDups. • We also find that many of the calls missed by SNP arrays but detected by CGH arrays are duplications.
Comparison to independent CNV data sets • To estimate the accuracy of CNV calls, we compared the variants from each array and algorithm to existing CNV maps (DGV; CNV calls from HapMap samples; Paired-end sequencing). • For most platforms, at least 50% of the variants have been previously reported. • There is better overlap with regions previously reported by array studies than regions originating from sequencing studies, which might be expected as all our CNV data stems from arrays. • It is important to note that all samples included in the current study have also been interrogated in other studies represented in DGV using different platforms. This likely contributes to a higher overlap than what would be found with previously uncharacterized samples.
Estimation of breakpoint accuracy • Algorithms with predefined variant sets (e.g., Birdsuite) and algorithms searching for clustering across samples (such as iPattern) show substantially better reproducibility in breakpoint estimation for common CNVs than do algorithms treating each sample as an independent analysis. • The data show that all platforms tend to underestimate the size of CNVs. This might be expected as the results reported for each algorithm correspond to the last probes within the variant showing evidence of a copy number difference. Arrays targeting known CNVs show the highest accuracy, as a result of their high probe density at these loci.
Discussion • the newer arrays, with a subset of probes specifically targeting CNVs, outperformed older arrays both in terms of the number of calls and the reproducibility of those calls. • Different algorithms give substantially different quantity and quality of CNV calls. algorithms developed specifically for a certain data type (e.g., Birdsuite for Affymetrix 6.0 and DNA Analytics for Agilent data) generally perform better than platform-independent algorithms (e.g., Nexus Copy Number) or tools that have been readapted for newer versions of an array (e.g., dCHIP on Affymetrix 6.0 data).