Download
1 / 15
160 likes | 397 Views
Signal to Noise for Global Modes of Subseasonal Atmospheric Variability. Edward Berry NOAA/NWS Dodge City, Kansas Klaus Weickmann NOAA/ESRL/PSD Boulder, Colorado. NOAA’s 32 nd Climate Diagnostics and Predictability Workshop

E N D
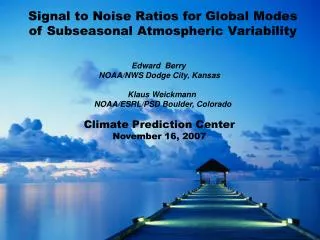
Signal to Noise for Global Modes of Subseasonal Atmospheric Variability Edward Berry NOAA/NWS Dodge City, Kansas Klaus Weickmann NOAA/ESRL/PSD Boulder, Colorado NOAA’s 32nd Climate Diagnostics and Predictability Workshop October 25, 2007
Overview > A Global Synoptic Dynamic Model (GSDM) > The MJO and the Global Wind Oscillation > Signal to noise for the MJO and the GWO > Example of week 2 forecast application > Conclusions and future work
Background > WB(2007) proposed a Global Synoptic Dynamic Model of subseasonal atmospheric variabilty (GSDM) > GSDM considers the interaction of 3 different time scales including the quasi-oscillatory MJO > Purpose of GSDM is to extend current thinking beyond the MJO; is there anything else? > The Global Wind Oscillation (GWO) represents a slow portion of the GSDM having a “mixture” of oscillatory and red noise processes (~6-10 day decay) > Purpose is to improve subseasonal forecasts, including extreme events
GLOBAL SYNOPTIC DYNAMIC MODEL (GSDM) Weickmann and Berry (2007): Each stage shows superposition of 3 time scales Wave energy dispersion favors high impact weather across USA Plains Below normal temperatures possible across central and eastern USA High Impact weather event possible along USA west coast Heavy precipitation event possible Southwest USA
L H L H H L H 6 2 L H H Indian Ocean West Pacific H H H L L L L H L H H L 7 3 L L H H Slow Meridional Rossby Wave Dispersion Favored 8 4 Western Hemisphere/Africa Maritime Continent 1 5
What is the Global Wind “Oscillation”? Represents portion of GSDM linked with AAM variations due to: Tropical Convection (implicitly) Momentum Transports (eddy vs. HC/FC) Torques (Mountain and friction) Captures poleward propagation of zonal mean wind anomalies Provides independent information on variations of the global circulation (a “semi-coherent form of climate noise”) 365-day segments; 1968-2006 for AAM and 1979-2006 for MJO MJO MJO, ~30 day MJO, F-M AAM Tendency Spectrum RMM1 Spectrum Eddy vacillations, mountain torques, etc. AAM Spectrum
5/11 Stage 2 4/3 5/16 5/26 Stage 1 Stage 3 4/9 4/16 5/22 Stage 4 “Global Wind Oscillation (GWO)” Define eight stages much like WH(2004) defined eight phases for the MJO Focus will be on Apr-May-Jun “snr”; week 2 prediction of trough over west USA late May 2007 Angular momentum added to atmosphere #1 #2 Angular momentum removed fm atmosphere
Poleward propagation of zonal mean zonal wind anomalies produced by momentum transports linked to MJO and GWO Transport-induced momentum sources & sinks provide a link between the MJO and GWO, and are the primary forcing for the poleward movement of zonal wind anomalies. GSDM describes “subseasonal events” produced by interaction and feedbacks between the GWO and the MJO. W E W W W E E E W E #1 E #2 E E E E W 3 3 2 2 4 4 1 1
L H H L L H H L 0.5 2.5 H H H 3.0 1.0 MJO? H Fast Zonal Rossby Wave Dispersion Favored 3.5 1.5 L H L H H L L H 2.0 4.0 H
Statistical Basis for Week-2 Forecast Made 11 May 2007 May 19 ~0.3 sigma 1.0 1.5 2.0 0.5 2.5 3.5 4.0 3.0
PDF for Apr-May-Jun Stage 2 vs. 4 Western USA 850 Temp P r o b a b i l i t y Stage 2 Stage 4 ~-2 ~-4 ~4 Standard Deviation
4 5 3 2 1 6 7 8 How big are MJO signals/impactsduring DJF? Signal/Noise for 2 meter air temperature Eight MJO Phases, DJF 1979-2006 Max ~+0.5 sigma => 67% prob > 0 anomaly
What is the synoptic evolution? Signal/Noise for ~250 mb streamfunction Four MJO Phases, DJF 1979-2006 Max ~+0.8 sigma => 77% prob > 0 anomaly L H H H L H L H L 2 3 L H H H H L H L 5 4
Summary and Future Plans Hypothesis: MJO and GWO are independently forced but significant interactions and feedbacks occur Eight phase compositing used for MJO and GWO; allows nonlinear assessment MJO and GWO signal/noise: tropics ~0.6-0.8σ; extratropics ~0.2-0.3σ Plan global, zonal and local composites for MJO and GWO, including zonal and vertical mean AAM budget terms Results will feed into rigorous daily monitoring and synoptic analysis Should be part of forecast process that includes operational forecast models, linear models and calibration procedures ; e.g., http://www.cdc.noaa.gov/people/jeffrey.s.whitaker/refcst/week2/ http://weatherclimatelink.blogspot.com