Download

1 / 28
280 likes | 380 Views
This study presents observed changes in the tropical tropopause, analyzing data from global radiosondes, GPS stations, and reanalysis datasets. It examines trends, bimodal distribution, and implications for climate change, including the expansion of the tropical belt. The research highlights short-term variability and the impact on various atmospheric dynamics, addressing open questions and suggesting further investigations.

E N D
Observed Recent Changesin the Tropopause Dian Seidel NOAA Air Resources Laboratory ~ Silver Spring, Maryland USA Bill Randel NCAR Atmospheric Chemistry Division ~ Boulder, Colorado USA AGU Chapman Conference on the Role of the Stratosphere in Climate & Climate Change 24-28 September 2007 ~ Santorini, Greece
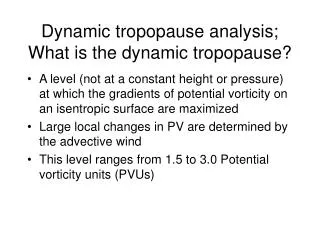
Motivation • Tropical tropopause changes may relate to • Stratospheric water vapor changes • Changes in stratospheric and/or tropospheric dynamics • Global tropopause changes may relate to • Anthropogenic (radiatively forced) climate change • Vertical temperature profile changes • Evolving understanding of • Thermal tropopause • Multiple tropopauses • Tropopause layers
Observations • Daily radiosoundings from 100 stations • NCEP/NCAR reanalysis (and ERA 40) • GPS Met
Global Tropopause Trends 1980-2004 • +64 ± 21 m/decade • -1.7 ± 0.6 hPa/decade • -0.41 ± 0.09 K/decade • 160 m rise • 4.2 hPa drop • 1.0 K cooling
Short-term Co-Variability of Tropopause Height and Atmospheric Temperature
Issues and Implications of a Wider Tropical Belt • Observed rate exceeds model projections. Why? • Seasonal, regional structure of changes have not been studied. • Related changes in • Hydrologic cycle, esp. subtropical dry zones • Jet streams and storm tracks • Tropical weather systems • Brewer-Dobson circulation
Summary • The global tropopause has risen and cooled since 1980. • Data issues pose problems estimating trends further back. • Short time scale changes assoc. with stratospheric and tropospheric T changes. Trends only assoc. with strat. T trends. • Tropopause heights are bimodally distributed in subtropics • Region is also where double tropopauses occur • Indicates ‘edge’ of tropical belt • Robust metric for trend detection • Tropical belt has expanded 2-8 deg lat in past 25 yrs • Evidence from tropopause and other, independent observations • Many open questions about processes, implications
References • Hu, Y., and Q. Fu: Observed poleward expansion of the Hadley circulation since 1979. Atmos. Chem. Phys. Disc., submitted. • Hudson R. D., M. F. Andrade, M. B. Follette, and A. D. Frolov, 2006: The total ozone field separated into meteorological regimes – Part II: Northern Hemisphere mid-latitude total ozone trends. Atmos. Chem. Phys.6, 5183-5191. • Randel, W. J., D. J. Seidel, and L. L. Pan, 2007: Observational characteristics of double tropopauses. J. Geophys. Res., 112, D07309, doi:10.1029/2006JD007904. • Reichler, T., and I. Held: Widening trend of the Hadley cell over the past 40 years. American Meteorological Society, Conference on Climate Variability and Change (Cambridge, MA, 2005). • Seidel, D.J., and W.J. Randel, 2007: Recent widening of the tropical belt: Evidence from tropopause observations. J. Geophys. Res., in press. • Seidel, D.J., and W.J. Randel, 2006: Variability and trends in the global tropopause estimated from radiosonde data, J. Geophys. Res., 111, D21101, doi:10.1029/2006JD007363.
WMO (1957) Lapse Rate Tropopause Definition • The first tropopause is defined as the lowest level at which the lapse rate decreases to 2°C/km or less, provided also the average lapse rate between this level and all higher levels within 2 km does not exceed 2°C/km. • If above the first tropopause the average lapse rate between any level and all higher levels within 1 km exceeds 3°C/km, then a second tropopause is defined by the same criterion as under (a). This tropopause may be either within or above the 1 km layer.