Download
1 / 19
190 likes | 356 Views
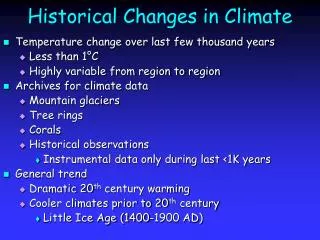
Observed Changes in Climate Extremes in Canada. Xuebin Zhang Climate Research Branch. What do we mean by extremes. Anything unusual, causing impacts Indices easy to compute Traditional indices Indices used by ETCCD Others. Trend identification. Methods Kendall-tau non-parametric method

E N D
Observed Changes in Climate Extremes in Canada Xuebin Zhang Climate Research Branch
What do we mean by extremes • Anything unusual, causing impacts • Indices easy to compute • Traditional indices • Indices used by ETCCD • Others
Trend identification • Methods • Kendall-tau non-parametric method • No distributional assumption • Robust against outlier • GLM framework • Different distributions • Software available • Compute changes in extremes (e.g. return value)
Trend in the Number of Spells Changes in cold spells and significant increases in warm spells in western Canada. Significant increases in cold spells in eastern Canada. Amir Shabbar
Trend in the Duration of Spells Generally, longer warm spells in western Canada. Longer cold spells and shorter warm spells in eastern Canada. Amir Shabbar
The 11-yr moving averages of annual time series of average number of heavy events per location over Canada south of 70N show strong decadal variability.
Trends and their 95% confidence intervals in averaged normalized percentiles of annual daily precip, annual daily maximum, number of days with precip, and average precip rate during the 20th century.
Conclusions • It is not getting hotter, it’s getting less cold • More warming in cold half of the year than warm half • More warming in daily minimum than daily maximum • Reduced frequency of coldest daily T
Conclusions • It’s not raining harder, it rains more often • No upward trends in the frequency/magnitude of heavy daily P events • Increased annual total precip due to more days with precip • Average rain rate decreased • Regional/seasonal differences
Papers • Zhang,X., F.W. Zwiers, and G. Li, 2003: Monte Carlo experiments on the detection of trends in extreme values, J. Climate (submitted) • Shabbar, A., and B. Bonsal, 2003: An assesment of changes in winter cold and warm spells over Canada. Natural Hazards, 29, 173-188. • Zhang, X., Hogg, W. D., and Mekis, E., 2001: Spatial and temporal characteristics of heavy precipitation events in Canada. J. Climate. 14, 1923-1936. • Bonsal, B., Zhang, X., Vincent, L., Hogg, W.D., 2001: Characteristics of daily and extreme temperatures over Canada. J. Climate, 14, 1959-1976 • Zhang, X., Harvey, K. D., Hogg, W. D., Yuzyk, T. R., 2000: Trends in Canadian Streamflow. Water Resources Research, 37, 987-998.