Download
1 / 1
10 likes | 121 Views
Sulfate Difference. Ammonium Difference. Nitrate Difference. Twenty-year NADP/NTN Seasonal Sulfate, Nitrate, and Ammonium Trends Christopher Lehmann, Christopher Quartier, and Van Bowersox NADP Program Office, Illinois State Water Survey. Summary

E N D
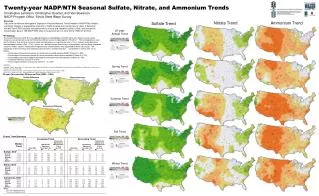
Sulfate Difference Ammonium Difference Nitrate Difference Twenty-year NADP/NTN Seasonal Sulfate, Nitrate, and Ammonium Trends Christopher Lehmann, Christopher Quartier, and Van Bowersox NADP Program Office, Illinois State Water Survey Summary Data from the National Atmospheric Deposition Program/National Trends Network (NADP/NTN) indicate significant changes in precipitation chemistry in North America over the last twenty years. A Seasonal Kendall Trend (SKT) analysis was performed on annual and seasonal sulfate, nitrate, and ammonium concentration data of 159 NADP/NTN sites in the continental U.S. from Winter 1985 to Fall 2004. Nitrate Trend Ammonium Trend Sulfate Trend 20-year Annual Trend • Methodology • The Kendal Seasonal Trend Test was applied following a methodology outlined in Lehmann, Bowersox and Larson.1 Analyses were performed using the EnvironmentalStats version 2.0 package of S-PLUS 6.1.2 The null hypotheses were that the trend is zero and that seasonal trends are homogeneous (significance level = 10%). Seasons were defined as meteorological seasons (Dec. – Feb. = winter, etc.) divided into two sub-seasons of precipitation volume above and below seasonal median volume. Precipitation-weighted mean concentrations were calculated for each sub-season. The magnitude of the trend slope was estimated using the Sen’s median estimator.2–3 Completeness criteria were set as follows. —Percentage of the summary period for which there are valid samples (NADP Criteria 1) ≥ 50% —Percentage of the summary period for which precipitation amounts are available (Criteria 2) ≥ 75% —Percentage of the total measured precipitation associated with valid samples (Criteria 3) ≥ 50% —Collection efficiency (Criteria 4) ≥ 50% —Percentage of complete seasons by Criteria 1 – 4 ≥ 50% • ______ • References • Lehmann, C.M.B., Bowersox, V.C., and Larson, S.M., “Spatial and Temporal Trends of Precipitation Chemistry in the United States, 1985-2002,” Environmental Pollution, 135: 347-361, 2005. • Millard, S.P. and Neerchal, N.K., Environmental Statistics with S-Plus, CRC Press: Boca Raton, 2000 • Helsel, D.R., and Hirsch, R.M., Statistical Methods in Water Resources, USGS: Reston, 1991. Spring Trend 20-year Concentration Difference Plots (2004 - 1985) Summer Trend Fall Trend 20-year Trend Summary Winter Trend