
Phase 5 Update
E N D
Presentation Transcript
Phase 5 Update Gary Shenk 7/13/05 Modeling Subcommittee
Outline • Sediment Phase5.0 wrap-up • Nutrient simulation setup • Nutrient input data descriptions
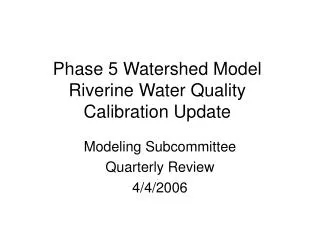
Sediment Pathway in Phase 5 Edge of Field BMP Factor 1. Sediment processes are simulated on the land surface resulting in an Edge-Of-Field sediment load. 2. A time series of Best Management Practice (BMP) factors is applied based on available data. 4. A delivery factor based on local geometry is applied (see below), resulting in the Edge-Of-Stream load. Land Acre Factor Edge of Stream Delivery Factor 3. A time series of land use acreage factors is applied. 5. Processes of deposition and scour are simulated in the stream, resulting in concentrations that can be compared to observations. In Stream Concentrations
Pasture => Pasture Poor Pasture => 9.5 * Pasture Hay => 1/3 Crop (P4 NRI) High till with manure => 1.25 * Crop High till no manure => 1.25 * Crop Low till with manure => 0.75 * Crop 1. Define Targets Agriculture Land use % of model Target relative to NRI estimate 9% 0.05% 7% 4% 1% 4% NRI provided direct estimates for Pasture. Poor Pasture is pasture that is heavily trampled near streams. It is a small land use that exports at a high rate. NRI provided estimates for Hay for the phase 2 model. The estimates were generally 1/3 of crop for that data set, so the proportion was kept. Low till is generally 40% lower than High Till, so that ratio was applied with an average value of the NRI estimate.
Wash off Generation Attachment Rainfall Detachment 3. Reduce Parameter Set Detached Sediment KSER KRER AFFIX NVSI Soil Matrix (unlimited) 4 parameters, 1 target
More hysteresis Greater effect of plowing 4. Find Best Values for Parameter Relations and Calibrate Correlation of sediment concentrations for each of 8 scenarios
River Calibration • Calibrated at ~130 sites with flow and TSS data. • Used system of rules for hand calibration. • No method of automated calibration developed so far.
If simulated or observed value is below 10 mg/l set it to 10 mg/l. Check simulation for 24 hours before and after observation and set simulated value to point closest to observation. ‘Windowed’ comparison Of the highest observed and simulated peaks at all calibration stations, almost as many peaks occurred one day apart, but few occurred on two days apart One day apart – 83% of the same day figure Two days apart – 19% of the same day figure
Status - Sediment • Phase 5.0 complete • Refinements expected in land-to-river delivery ratio • Automated river calibration will be investigated • Phase 5.x • To come out periodically over the next 18 months, with advances in calibration methods and input data
Nutrient Calibration Edge of Field BMP factor Edge of Stream Land Acre Factor Delivery Factor
Nutrient Calibration Edge of Field • Based on Targets acquired from 3 sources: • Literature Survey • Sparrow analysis of land use • Mass Balance
Nutrient Calibration Edge of Field • Calibration Methodology • Calibrate for small trend in nutrient storage and to hit the targets • Based on experience with phase 4 • Hundreds of parameters controlling export; fewer are sensitive
Export Export Export Export Export Export Export Nitrogen Cycle in Watershed Model Forest After HSPF documentation Trees Denitrification Roots Leaves Nitrate Atmospheric Deposition Particulate Particulate Solution Labile Refractory Ammonia Organic N Organic N Solution Solution Adsorbed Labile Refractory Ammonia Organic N Organic N
Export Export Export Export Export Export Export Nitrogen Cycle in Watershed Model Forest After HSPF documentation Trees Denitrification Roots Leaves Nitrate Atmospheric Deposition Particulate Particulate Solution Labile Refractory Ammonia Organic N Organic N Solution Solution Adsorbed Labile Refractory Ammonia Organic N Organic N
Forest Harvested Forest Low Intensity Pervious Urban High Intensity Pervious Urban Low Intensity Impervious Urban High Intensity Impervious Urban Bare-construction Extractive Natural Grass High Till with manure Nut Man High Till with manure Low Till with Manure Nut Man Low Till with manure High Till without manure Hay with nutrients Nut Man Hay with nutrients Hay without nutrients Alfalfa Nut Man Alfalfa Pasture Nut Man Pasture Trampled Animal Feeding Operations Nursery Land Uses Simulated
Differences between p4 and p5 • Phase 4 used a combination of coefficient modeling (PQUAL) and mass balance modeling (AGCHEM). Phase 5 will be all mass balance modeling • Phase 4 reset the mass balance at the end of each year to stabilize the simulation. In phase 5, we will attempt to stabilize without resetting • Parameters governing nutrient uptake will change during the simulation to reflect crop makeup.
Nutrient Calibration Edge of Field BMP factor Edge of Stream Land Acre Factor Delivery Factor
Nutrient Calibration BMP factor Land Acre Factor Data Sets Under Development
Nutrient Calibration Phosphorus similar to sediment? Assume nitrogen targets are already EOS? Take land-to-river and small stream delivery factors from Sparrow? Delivery Factor
Nutrient Calibration Initial river calibration will be similar to the sediment calibration methodology Calibration by hand Determine sensitive parameters Determine calibration rules
Nutrient Status • Simulation “on the graph paper” • Still need some inputs, but we are running sensitivity while we are waiting
Nutrient Inputs • Dry Atmospheric Deposition • Crop Uptake • Manure and Fertilizer Applications • Septic
Crop Need and Nutrient Uptake • Model requires monthly max Crop Uptake Uptake = (Max Yield) * (Nutrient Content) • Max Yield – Ag Census, STATSGO • Nutrient Content - from USDA plant nutrient content database. • Monthly uptake fractions varied by USDA plant hardiness zones
Low High Crop Need on Composite Crop* Phase 5 Crop Need Phase 4 Crop Need • Crop need calculated for a corn, soy, small grain composite crop after legume credit. Needs range between approximately 50 and 150 lbs / acre for both phases.
Nutrient Loading Rules • Manure stays in a county unless transport data are supplied. • All fertilizer sold in the model domain is divided between land uses and regions such that all land uses receive a constant multiplier of crop demand, except: • Nutrient Managed lands receive less nutrients. N or P based.
Septic Systems • Calculated from U.S. Census. 1970-1990 • Load = fraction on septic * people * load per person • Fraction on septic extrapolated from trends (1970, 1980, and 1990). • People from census estimates and projections • Load per person is a constant. • distributed to land-river segments based on low density residential acreage.
High Low Septic Loading Rate Total Number of Systems Systems per acre Low-Density • Septic Accounts for approximately 4% of total N produced in the watershed. Darker color indicates higher density.
New Code • HSPF13 - Previously available only for Lahey fortran on PC • Programmed unimplemented intrinsic functions • Provided ‘work-arounds’ for non-gcc features • Made linux compilation scripts. • Submitting to Aquaterra for clean-up.
Schedule • July – Sensitivity tests and setup • August – Edge-of-Stream automated calibration • September – Hand calibration of Rivers • October – Get phase 5.0 nutrient loads to WQM