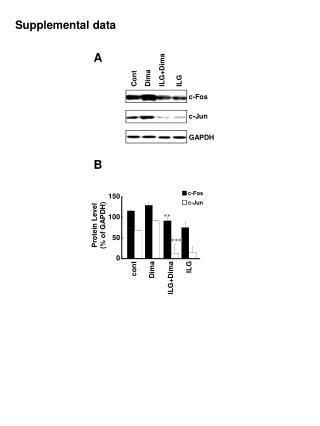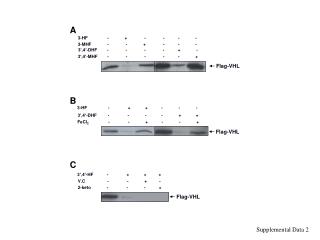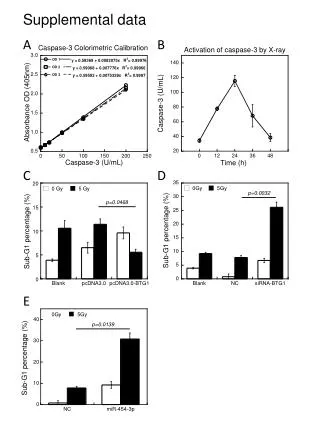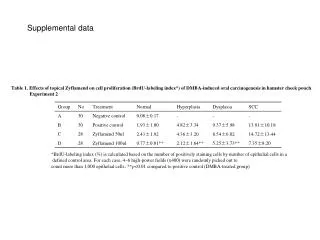
Supplemental Data
This study examines the relationships between IGF-IR gene signatures, IGF1 mRNA levels, and patient survival outcomes in breast cancer. We utilized univariate and multivariate Cox proportional hazard regression models to analyze the impact of these factors. The analysis included adjustments for disease stage, tumor grade, lymph node involvement, and estrogen receptor status. Kaplan-Meier survival curves illustrate significant differences in disease-free and overall survival across molecular subtypes in the Turin cohort. Our findings underscore the importance of IGF signaling pathways in breast cancer prognostics.


Supplemental Data
E N D
Presentation Transcript
Supplemental Data Lyndsay Harris corresponding author
Figure X Associations of IGF-IR signatures in combination with IGF1 mRNA and outcome 1. HR: hazard ratio; 2. 95% CI: 95% confidential intervals; 3. IGF activation score: -1=no activation, 0= intermediate; 1=activation, which was derived from the Pearson correlation between the IGF gene signature pattern created by Creighton et al. and the gene expression value of the tumor generated by illumina microarray assays in Italy study. 4. Adjustment for disease stage, tumor grade, lymph node involvement status and estrogen receptor status. 5. IGF1 mRNA was a binary variable (high= greater or equal to the median of IGF 1 mRNA, low=less than the median of the expression) generated by using quantitative RT-PCR in tumors from Italy study. The Univariate and multivariate Cox proportional hazard regression models evaluated the association of the IGF-1R signature and patient survival.
1.00 0.75 0.50 Survival Distribution Function 0.25 0.00 0 20 40 60 80 100 120 Time (month) Supplemental Figure 1: Kaplan-Meier disease free survival curves in Turin cohort stratified by molecular subtypes LumA (n=49) Normal (n=40) Her2 (n=33) Basal (n=30) LumB (n=52) P=0.0039
1.00 0.75 0.50 Survival Distribution Function 0.25 0.00 0 20 40 60 80 100 120 Time (month) Supplemental Figure 2: Kaplan-Meier overall survival curves in the Turiin cohort stratified by molecular subtypes LumA (n=49) Normal (n=40) Her2 (n=33) LumB (n=52) Basal (n=30) P=0.0019