Tip60 and p400 mRNA Expression Levels Across Cancer Cell Lines
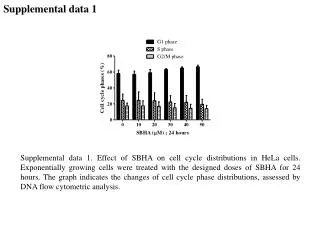
This study examines the relative expression levels of Tip60 and p400 mRNA in various cancer cell lines compared to normal HIEC cells. Total RNA from RKO, LoVo, HIEC, HT29, HCT8, Caco-2, SW620, and HCT116 cells was extracted, reverse transcribed, and analyzed using real-time PCR. The expression of Tip60, p400, and GAPDH mRNA was quantified, with Tip60 and p400 mRNA levels normalized to GAPDH and calculated relative to HIEC cells. Data from 3 independent experiments are presented, showing mean and standard deviation values.

Tip60 and p400 mRNA Expression Levels Across Cancer Cell Lines
E N D
Presentation Transcript
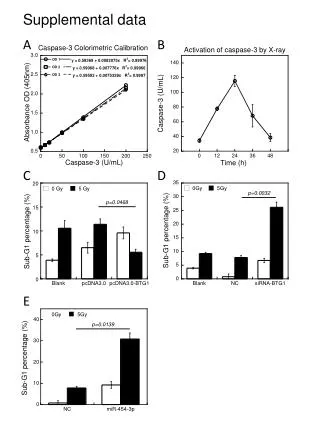
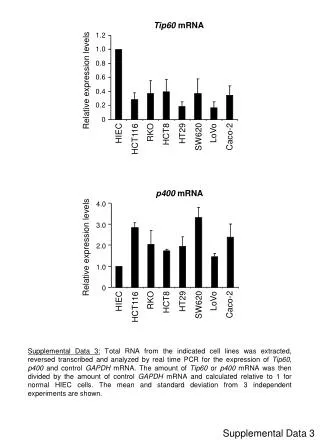
Tip60 mRNA 1.2 1.0 0.8 0.6 Relative expression levels 0.4 0.2 0 RKO LoVo HIEC HT29 HCT8 Caco-2 SW620 HCT116 p400 mRNA 4.0 3.0 2.0 Relative expression levels 1.0 0 RKO LoVo HIEC HT29 HCT8 Caco-2 SW620 HCT116 Supplemental Data 3: Total RNA from the indicated cell lines was extracted, reversed transcribed and analyzed by real time PCR for the expression of Tip60, p400 and control GAPDH mRNA. The amount of Tip60 or p400 mRNA was then divided by the amount of control GAPDH mRNA and calculated relative to 1 for normal HIEC cells. The mean and standard deviation from 3 independent experiments are shown. Supplemental Data 3