Download
1 / 32
320 likes | 418 Views
Learn how to seamlessly interact with GIS software through R, explore diverse data types, handle large files, and plot rasters with ease. Discover the power of integrated functionality and optimize your workflows today.

E N D
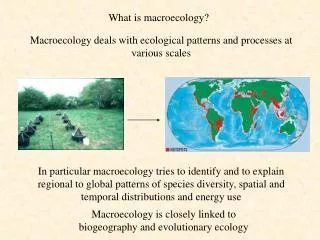
R for Macroecology GIS + R = Awesome
R and GIS • My point of view • The best approach is to do everything in R, interacting with GIS software only when necessary • But, • You can also take the opposite approach, through integrated R functionality within GRASS GIS
Today’s plan • Geographic data types in R • Handling huge files • R in GIS
Geographic data in R • Data types • Vector • Raster • Packages • maptools • raster
Package maptools • readShapePoly() reads in a GIS shape file • Can be plotted • Various functions for converting among formats • Merge polygons
Package raster • the raster package has everything you need for handling rasters • Read, write, plot, all kinds of queries and manipulations
What is a raster object? • A raster contains • A vector of values • A size (nrow, ncol) • Spatial information (extent, projection, datum) • A raster can have some of these things missing (for example, no data values, or no projection)
What is a raster object? > mat = raster(“MAT.tif”) > mat class : RasterLayer dimensions : 2882, 2880, 8300160 (nrow, ncol, ncell) resolution : 0.004166667, 0.004166667 (x, y) extent : 0, 12, 48, 60.00833 (xmin, xmax, ymin, ymax) projection : +proj=longlat +ellps=WGS84 +datum=WGS84 +no_defs +towgs84=0,0,0 values : C:/Users/brody/Documents/Teaching/R for Macroecology/Week 4/MAT.tif min : ? max : ? Where’s the data?
Raster objects are different! • Normal objects are stored in memory, for fast access • Raster objects are not always • When you define a raster object R looks at the summary information and remembers the hard drive locations • Small rasters often do reside in memory • Advantages and disadvantages
The structure of a raster object • Stored as a big vector ncol = 8 1 2 3 4 5 6 7 8 9 . . . . n 1 2 3 4 5 6 7 8 9 . . . . . . . . . . . . . . . . . . . . . . . . . . . . . . . n
Create a new raster > newRaster = raster(nrows = 10,ncols = 6,xmn = 0,xmx = 6,ymn = 50,ymx = 60,crs = "+proj=longlat +datum=WGS84") > newRaster class : RasterLayer dimensions : 10, 6, 60 (nrow, ncol, ncell) resolution : 1, 1 (x, y) extent : 0, 6, 50, 60 (xmin, xmax, ymin, ymax) projection : +proj=longlat +datum=WGS84 +ellps=WGS84 +towgs84=0,0,0 values : none
Create a new raster > newRaster = setValues(newRaster,1:60) > plot(newRaster)
Getting values from a raster > newRaster[22] [1] 22 > newRaster[2,4] [1] 10 > getValues(newRaster)[12] [1] 12
Plotting a raster • plot() • xlim and ylim control plotting window (just like usual) • col specifies the color palette (thisworks a bit differently) • subsample (defaults to TRUE) determines whether or not to plot every pixel (if TRUE, only plots at most maxpixel pixels) • colors • rbg(), rainbow(), heat.colors(), terrain.colors(), topo.colors() • I also like the colors in fBasics package • Can also use image() • Similar, but no scale bar
Plotting examples plot(newRaster,col = rgb(seq(0,1,0.2),0.5,0.5)) plot(newRaster,maxpixels = 7) plot(newRaster,xlim = c(2,5),ylim = c(52,59),col = rainbow(50))
A few useful ways to explore rasters • zoom() • Opens a new active plotting window with the selected region • click() • Queries a value, if xy = TRUE, also returns the x and y coordinates
Seeing a function • Many of R’s functions are written in R! • You can define your own variations on core functions > lm function (formula, data, subset, weights, na.action, method = "qr", model = TRUE, x = FALSE, y = FALSE, qr = TRUE, singular.ok = TRUE, contrasts = NULL, offset, ...) { ret.x <- x ret.y <- y cl <- match.call() ... }
Timing your code • We are getting to the point where running time can be limiting • There are often multiple possible solutions, it can be worth your time to try to find the fastest • Sys.time() > S = Sys.time() > x = rnorm(1000000) > E = Sys.time() > E-S Time difference of 0.375 secs
Handling giant rasters • Huge rasters can be a pain to work with • They can regularly be larger than your RAM • R solves this by not reading into RAM • But – if you are doing lots of queries on a raster, it can be much faster to convert it to a matrix first • Do what you want to do, and then use rm() to free up the memory that the matrix was using
Raster data in different formats Raster Slow access Little RAM usage 1 2 3 4 5 6 . . . . 60 1 2 3 4 5 6 7 8 9 10 11 12 13 14 15 16 17 18 19 20 21 22 23 24 25 26 27 28 29 30 31 32 33 34 35 36 37 38 39 40 41 42 43 44 45 46 47 48 49 50 51 52 53 54 55 56 57 58 59 60 Vector Fast access Heavy RAM usage Entries in same order as raster Matrix Fast access Heavy RAM usage Rows and columns match raster
Raster data in different formats getValues() as.matrix() 1 2 3 4 5 6 . . . . 60 1 2 3 4 5 6 7 8 9 10 11 12 13 14 15 16 17 18 19 20 21 22 23 24 25 26 27 28 29 30 31 32 33 34 35 36 37 38 39 40 41 42 43 44 45 46 47 48 49 50 51 52 53 54 55 56 57 58 59 60
Raster data in different formats getValues() as.matrix() raster() setValues() 1 2 3 4 5 6 . . . . 60 1 2 3 4 5 6 7 8 9 10 11 12 13 14 15 16 17 18 19 20 21 22 23 24 25 26 27 28 29 30 31 32 33 34 35 36 37 38 39 40 41 42 43 44 45 46 47 48 49 50 51 52 53 54 55 56 57 58 59 60
Raster data in different formats getValues() as.matrix() raster() setValues() 1 2 3 4 5 6 . . . . 60 1 2 3 4 5 6 7 8 9 10 11 12 13 14 15 16 17 18 19 20 21 22 23 24 25 26 27 28 29 30 31 32 33 34 35 36 37 38 39 40 41 42 43 44 45 46 47 48 49 50 51 52 53 54 55 56 57 58 59 60 as.matrix( ,by.row = T) as.vector(t())
Hard drive management • It can be a pain to have large rasters clogging up your hard drive • It would be nice to be able to store them zipped, unzip them automatically when you need them in R, and then delete the unzipped data • Fortunately, that’s easy!
unzipping and deleting • R function unzip() • You point it to the file you want unzipped, and it does it • Then read in the unzipped file • When you are done with it, use file.remove() to delete it, leaving just the compressed data behind, to save space • BE VERY CAREFUL!
Remote data • You can do even better – if data are stored at stable URLs, you can download, unzip, work on and delete data all from R • download.file(url,filename) • unzip(filename) • do stuff • file.remove(filename)
Command lines • Anything you can run on a command line can be done from R, using shell() • Do file manipulations, run scripts, run executables
Linking R and GIS • File formats • Generating Arc scripts in R • Running R within GRASS GIS
File formats • writeRaster() • tif, img, grd, asc, sdat, rst, nc, envi, bil • For me, I have found that tif seems to produce hassle-free integration with Arc and others • write.shapefile() (package shapefiles) • Also has functions for shp, shx and dbf specifically
Arc scripts from R • It’s probably not the best way, but if there is something you want to do in Arc, you can generate the script using R
R and GRASS • GRASS is a free GIS • R commands can be accessed from within GRASS using the spgrass6 package in R • Lets you do any statistical thing you’d like from within a (fairly) standard GIS