Download
1 / 50
500 likes | 652 Views
Macroecology & uneven distributions of wealth. Ken Locey. http://tchester.org/srp/plants/communities/figures/global_biodiversity_by_area.gif. 183,913,348 records of birds in the Global Biodiversity Information Facility database. Macroecology. …study of ecological relationships

E N D
http://tchester.org/srp/plants/communities/figures/global_biodiversity_by_area.gifhttp://tchester.org/srp/plants/communities/figures/global_biodiversity_by_area.gif
183,913,348 records of birds in the Global Biodiversity Information Facility database
Macroecology …study of ecological relationships that involves characterizing and explaining statistical patterns of… Abundance: ni/N Distribution: f(k;λ) =λke-λ/k! Diversity: H’ = -Σpi*ln(pi)
Geographic range patterns Land mammals North-South (km) Land birds 100 1,000 10,000 East-West (km)
Metabolic Theory of Ecology (MTE) Ecological phenomenon ∝M3/4e-E/kt Temp. corrected max. rate of whole organism biomass production Slope = 0.76 R2 = 0.99
Species Abundance Distribution (frequency distribution) frequency Abundance Class
Math & Stats GIS Metabolic rate ∝ M3/4e-E/kt Information: Tools Computing
Sharing COLLABORATION & SHARING Code development Source networks
Undergraduate &Graduate research Grad School Skills GIS Programming Published Research Data management Math & Stats Collaboration Jobs
whitelab.weecology.org macroecology.ku.dk Center for Macroecology, Evolution, & Climate www.macroecology.ca
Species Abundance Distribution (frequency distribution) frequency Abundance Class
Species Abundance Distribution (Rank-abundance distribution) Abundance Rank in Abundance
Wheat Production (tons) tons 62.9 104588178.7
Poverty in Rural America, 2008 54.5 - 25 25 - 20 20 – 14.3 14.2 – 12.2 12.1 - 10 10 – 3.1 Percent in Poverty
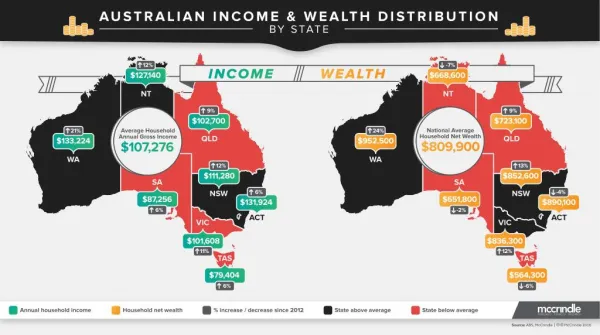
Distributions of Wealth (DOW) Supreme importance attaches to one economic problem, that of the distribution of wealth. Is there a natural law according to which the wealth of society is divided? – John Bates Clark Wealth: sources of human welfare which are material, transferable, and limited in quantity.
Distributions of Wealth (DOW) Total quantity (Q) Community abundance Global Oil Consumption GDP, GNP Number of entities (N) Species Nations Economic classes
Distributions of Wealth (DOW) If Q = 10 and N = 3, then: 8 unordered ways to sum N positive integers to obtain Q 8+1+1 7+2+1 6+3+1 6+2+2 5+4+1 5+3+2 4+4+2 4+3+3
The feasible set(all possible shapes of the DOW) 16,958 shapes for Q = 50 & N = 10 Wealth Rank
Heat mapping the feasible set(or a random sample) Q=1,000 N=80 ln(wealth) Rank
Heat mapping the feasible set(or a random sample) ca. 4.02x1029 possible shapes for N=1000 & S=80 ln(abundance) Rank in abundance
Ecological DOWs(species-abundance distributions) Q = Total community abundance (i.e. number of individuals) N = Species richness (i.e. number of species)
OBSERVED: [1, 2, 10, 12, 20, 30, 40, 60, 110] PREDICTED: [1, 2, 11, 11, 22, 28, 43, 50, 117] 102 101 100 Observed wealth R2 = 0.99 R2 per site 100 101 102 Predicted wealth
102 101 100 Observed abundance R2 = 0.99 R2 = 0.89 R2 = 0.80 R2 = 0.75 R2 per site 100 101 102 Predicted abundance
102 101 100 Observed abundance R2 per site R2 = 0.99 R2 = 0.89 R2 = 0.80 R2 = 0.75 R2 per site 0.0 1.0 100 101 102 Predicted abundance
R2 = 0.93 102 101 100 Observed abundance 0.0 1.0 R2 per site 100 101 102 Predicted abundance
Food & Agriculture Organization of the UN US Dept of Energy, Energy Information Admin.
Food supply among nations (1960-2010) grams/capita/day tons * 0.0001 grams/capita/day * 0.1 0.83 0.91 0.93 Observed supply Predicted supply
Population sizes among nations (1960-2009, millions of people) 0.69 0.77 0.91 Observed pop. size Predicted pop. size
Oil use among nations (1980-2009, barrels per day * 0.01) 0.88 0.92 0.92 Observed Predicted
0.93 0.88 0.90 0.91 0.91 0.89 Observed home runs 0.94 0.93 (2002-2010) http://mlb.mlb.com Predicted home runs
Are DOWs similar to the average of possible shapes? …very often Do Q and N constrain the DOW more than ever realized? …Yup Is the feasible set good for more than predictions?…Absolutely Is combinatorial explosion a pain in the *expletive*?…Not for long…?
Funding • USU College of Science • Willard L. Eccles Fellowship • NSF CAREER award to Ethan White • Research grant from Amazon Web Services
Acknowledgments • Individuals, agencies, organizations responsible for the collection and management of the: • Breeding Bird Survey, Christmas Bird Count, Forest Inventory and Analysis, Mammal Community Database, North American Butterfly Association, Argonne National Laboratory’s MG-RAST metagenomic server • Colleagues & Collaborators • USU: Ethan White, Xiao Xiao, Dan McGlinn • Berkeley Harte Lab: Justin Kitzes • SESYNC: Bill Burnside • UCO college of Math and Science
The feasible set as a framework Understanding Comparing Inequality
Percentile of the feasible set Gini’s coefficient of inequality
The feasible set(all possible values of species evenness) Total abundance, N = 60 Species evenness Species richness, S
Feasible sets are dominated by hollow-curves Q=50, N=20 Q=50, N=10 Evenness (Smith & Wilson, 1996)
MTE prediction: species richness decreases with temperature (S ∝ Ae-Ea/kT ) Computer Science Student: Biology student: model development data scraping & management microbe data, reasons why MTE should (not) work for microbes + Chemistry Student models based on chemical kinetics/activation energy Conclusion(?) Temperature-richness predictions of MTE do not hold for diverse microbe communities as tested using several models of chemical kinetics. This may be explained by microbial dormancy and dispersal.
Body-size distributions Land birds Land mammals continental Number of species regional patch Body mass (g)