Download
1 / 16
160 likes | 313 Views
Fundamental patterns of macroecology. Patterns related to the spatial scale. Patterns related to the temporal scale. Patterns related to biodiversity. Patterns related to the spatial scale. Theory of Island biogeography. Single island. Immigration. Extinction. Rate.

E N D
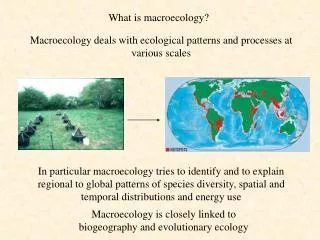
Fundamental patterns of macroecology Patterns related to the spatial scale Patterns related to the temporal scale Patterns related to biodiversity
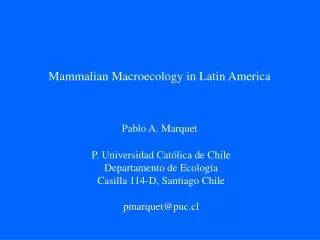
Patterns related to the spatial scale Theory of Island biogeography Single island Immigration Extinction Rate Equilibrium species richness Robert MacArthur (1930-1972) Edward O. Wilson(1929-) Species richness tries to understand diversity from stochastic colonization of islands. Colonization rates depend on island area and isolation Extinction rates depend on island area The model is species based Two islands Immigration Extinction Near by Small Large Rate Isolated Equilibrium species richness Species richness
Theory of Island biogeography Galapagos islands S = S0e-kI S = S0f(A) Species richness Species richness Isolation Area
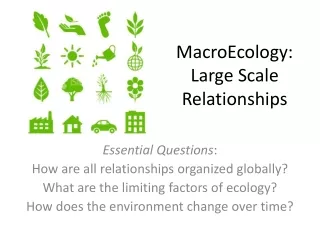
300 250 200 Number of species 150 100 y = 5.5x 0.85 50 R 2 = 0.77 0 0 20 40 60 80 100 Number of seamounts Patterns related to the spatial scale The species – area relationship Species accumulation on seamounts in the pacific west of Australia • Thenumber of speciesraiseswiththearea under study • Thisrelationoftenfollows a powerfunction • Theslope z of thisfunctionmeasureshowfastspeciesrichnessincreaseswithincreasingarea. Itistherefore a measure of spatialspeciesturnroverorbeta diversity • Theintercept S0is a measure of theexpectednumber of species per unit of area. Itistherefore a measure of alphadiversity • Outlinersfromthispatternmarkecologcalhotspotsorcoldspots • Changesinslopethrough time point to disturbanceslikehabitat fragmentationordestruction S = S0Az + e log S = log S0 + z logA + e
Slopes of species – area relations reported by various researchers
Slopes of species – area relations reported by various researchers
Empirical conclusions • Most regional SARs are best described by a power function model • Island slopes z of the power function are mostly higher than mainland slopes • Island slopes are in the order of 0.2 to 0.6 • Mainland slopes are in the order of 0.1 to 0.3 • Slopes of local SARs are higher than those of regional SARs How to explain SARs? • Passive sampling • Habitat diversity • Area per se • Fractal geometry
Passive sampling Assume a number of sites randomly colonized (occupied) by individuals of a number of species. The abundances of the colonizing metacommunity need not to differ in abundances but most often they do. The probability tha a species i is not found in the k-th patch is (ak is the relative area of a patch k, ni is the number of individuaks of species i. The probability to find a member of i and therefore this species is then The rise of species richness S(a) with area is a then given by (Coleman et al. 1982) Passive sampling predicts an increase of species richness with area. The slope of this increase is lower than observed in nature.
Area per se and habitat diversity Faunal groups of the Lesser Antillean (Ricklefs and Lovette 1999) Stepwise multiple regression shows how various factors influence species numbers of mammals in South America (Ruggiero 1999)
How to assess diversity patterns? Grid approach Species richness within each grid is assessed from Museum collections. Environmental data come from Satellite images. An important variable is the distance between grid cells: Spatial autocorrelation
How to infer large scale patterns? Species richness of European bats for 58 European countries and larger islands (Ulrich et al. 2007) Formulating a linear regression model Vespertilio murinus
SARs and fractal geometry In 1999 John Harte and co-workers asked whether thre is a common theme behind the spatial distribution of all plant and animals species. They argued that fractal geometry might explain observed patterns in the abundance and distribution of species Using a probabilistic argument they showed that SAR EAR, Endemics – area relationship Subsequent studied showed that this holds only approximately, but reasonably well Graphic: Jean-Francois Colonna Important: Spatial distribution of single species is self similar The fractal dimension of each species can be used as a species fingerprint. Cerro Grande Wildfire / Weed Map
8 SLO MAZ AL CH A 7 6 TRA 8 AND FL 5 RUS 7 ln S 4 a + 3 6 IRL ln(S )+CL 0 0.95 2 MAD 5 AZO 1 ln S 4 0 a - 4 3 6 8 10 12 14 16 2 ln Area [km ] 2 ln(S )-CL 0 0.95 1 6 B 0 5 MAZ 0 2 4 6 8 10 4 L ln Area ln end. species 3 FL 2 1 IRL N CAN 0 4 6 8 10 12 14 16 2 ln Area [km ] How to use SARs? SARs are used to estimate species numbers and to detect ecological hot- and cold spots Estimating species numbers The mean number of bird species in Poland [312685 km2] is about 350, the total European [10500000 km2] species number is about 500. How many species do you expect for the Czech Republic [78866 km2]? The true number is about 380. What causes the higher number of birds in the Czech Republic? We extrapolated outside the range for which the SAR was defind by our data. The estimate of the European number is very imprecise.
10000 between biotas: z = 0.53 1000 Number of species 100 within a regional pool: z = 0.09 10 small areas: z = 0.43 1 1.0E-01 1.0E+01 1.0E+03 1.0E+05 1.0E+07 1.0E+09 1.0E+11 1.0E+13 Area [Acres] Species - area relationship of the world birds at different scales
1000000 Intercontinental scale: z = 0.5 100000 10000 Number of species 1000 100 Regional scale: z = 0.14 10 Local scale: z = 0.25 1 1.E-04 1.E-02 1.E+00 1.E+02 1.E+04 1.E+06 1.E+08 1.E+10 1.E+12 2 Area [km ] The species – area relationship of plants follows a three step pattern as in birds
Today’s reading SAR: http://math.hws.edu/~mitchell/SpeciesArea/speciesAreaText.html Theory of Island biogeography: http://books.google.pl/books?id=yRr4yPSyPvMC&dq=Theory+Island+biogeography&printsec=frontcover&source=bn&hl=de&ei=HsibSbSJEdSujAfZ7qS9BQ&sa=X&oi=book_result&resnum=4&ct=result#PPA4,M1 Ulrich W., Buszko J. 2005. Detecting biodiversity hotspots using species - area and endemics - area relationships: The case of butterflies. Biodiv. Conserv. 14: 1977-1988 pdf Ulrich W., Buszko J. 2003b. Species - area relationships of butterflies in Europe and species richness forecasting. Ecography 26: 365-374. pdf