Download
1 / 28
280 likes | 419 Views
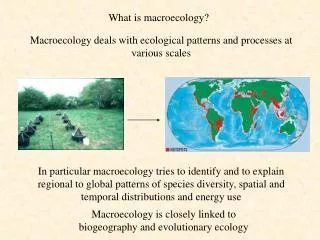
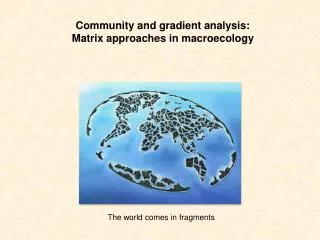
Community and gradient analysis: Matrix approaches in macroecology. The world comes in fragments. Biogeography. Species occurrences across a fragmented landscape. Islands Lakes River bed and irrigation systems

E N D
Community and gradient analysis: Matrix approaches in macroecology Theworldcomesinfragments
Biogeography Speciesoccurrencesacross a fragmentedlandscape Islands Lakes River bed and irrigation systems Mainlandscontinentaldistributionshabitat islandsmountaintops and valleysfragmentedlandscapesscattereddistributed host plants Cities and anthropogenichabitats Routes of speciesinvasion Experimentalplots (natural, macro-, mesocosmexperiments)
Galapagos Islands The Darwin finches
The Darwin finches (Sanderson, Am. Scient. 2000) A presence – absencematrixreflectsthedistribution of speciesacrosssites
Thedistribution of groundbeetlesacrossMazurianlakeislands In presence – absencematriceszerosdenotespeciesabsence, onesdenotespeciespresences. Absencesmight be causedeither by realabsences of speciesor by incompletedetection.
Biogeographicmatricesarestaticdescriptions of colonizationpatterns. Colonization and extinctionare permanent processes. In reality presence – absencepatternchangewholethe time. Itmakestherefore a differenceif we usetemporal point data to constructourmatricesor a time series. Time series data contain much moreentries but might be ecologicallyunrealistic.
Time axis Time seriesmatriceshavetoo many entries and do not reflectrealecologicalpatterns. They do not giveinformation on realspeciesinteractions Dispersion Extinction For a properassessment of ecologicalpatterns we need point data. Thecomparison of point and time seriesmatricesgivesinformationaboutdispersionrates.
Thedistribution of groundbeetlesacrossMazurianlakeislands Abundancematricescontainadditionalinformation. Abundancematricesmight be based on point oraveraged time series data.
Mutual interactionmatrices Foodwebs Host – parasite networks Plant – herbivore networks Pollination networks Predator – prey networks Competition networks Speciesimpact networks Foodwebexample Translation of a foodwebinto a matrix. Onesdenotedirectlinks. Typicalterrestrialfoodweb Generalistpredator Specialistpredator
Interactionstrengthisexpressed by probabilitiesor by frquencies of interaction A quantitativefoodweb
Interactionmatrices Pollination networks Plants FromOllerton et al. 2003 FromKratochwil et al. 2009 Bees
How to present a presence – absencematrix? Unsortedraw data Sortedaccording to marginaltotals Sorted to maximizespeciesturnover Correspondenceanalysis Reciprocalaveraging (seriation)
Ecologicalgradients SpatialorecologicalDistance Sorting of matrixcolumnsaccording to ecologicalgradientsallows for an assessment of thetheimportance of environmentalvariables.
Basic patterns Speciesturnover Speciesturnoverorbeta diversityis a specialcase of speciessegregationwherethereis an orderingchangeinspeciescompositionacrossthesites. Raw matrix Ordinatedpresence – absencematrix Spatialdistancebetweenspecies Ecologicaldistancebetweensites Unexpectedoccurrences
Nestedsubsetpatterns Unexpectedabsence Unexpectedpresence Random matrixorderedaccording to row/columtotals A nestedmatrixorderedaccording to row/columtotals • A patternwherethe species composition of speciespoorer assemblages form true samples of the species composition of speciesricher assemblagesiscalled a nestedsubsetpattern. Nestedness iscommonamongbiogeographical and interactionmatrices.
The mass effect Regionalabundancewithinthemetacommunity Proportionalcolonization of sitesaccording to metacommunityabundance and carryingcapacities Colonization of siteswithdifferentcarryingcapacities (areas) Passivesamplingcauses a nestedsubsetpattern. The mass effectisfundamental to allneutralmodelsinecology. Ecologistsaremainlyinterestedinprocessbeyond mass effects. Theyareinterestedinecologicalinteractions.
Negativespeciesassociations Aggregatedmatrix Checkerboardmatrix Reciprocalaveraging Any perfectlysegregatedmatrixcan be reordered by reciprocalaveraging to appearhighlyaggregated. Checkerboardsare 2x2 submatriceswithperfectspeciesexclusion. Classicalcompetitontheorypredicts high numbers of checkerboards under intensecompetition of species. Aggregation and segregationareinfacttwosites of the same coin. Whichmatrixisexpected under severecompetition?
Positivespeciesassociations Compartmentedmatrices Boundaryclumping. Speciesrangesarecoherent.Thereare no gaps (embeddedabsences) inthesequence of occurrence. Theexistence of welldefinedcompartmentspointsalways to thefactthatthespeciesassemblage under studyis not homogeneous (a true community) but an artificialsample of species. In thesecases we shoulddealwiththecompartments as separatecommunities. Matrixanalysisisable to identify natural ecologicalentities. Toolsareeitherclusteranalysis of ordination.
Patternsinbiogeographicpresence – absencematrices Thecompetitionview of nature Jared Diamond’s 1975 assembly rules 1. „If one considers all combinations that can be formed from a group of related species, only certain ones of these combinations exist in nature.” 5. „Some pairs of species never coexist, either by themselves or as part of a larger combination.” JaredDiamond A neutralview of nature The Tallahassee mafia and his followers (particularly Steven Hubbell and otherneutralists) arguedthatpatterns of speciesco-occurrence(associations) aremainly random. Dan Simberloff
Thefrequency of segregatedmatricesinecologicalmeta-communities 34 of a total of 96 meatcommunities (35%) weresignificantly (twosided 95% confidencelimits) segregated. Gotelli, McCabe 2002 Standardizedeffectsize Thedistribution of Z shouldhave a mean of zero and a standard deviation of one. Thus under a normalapproximation95% of valuesshouldrangeinside-1.96 < Z < +1.96 P(m - 1.96s < X < m + 1.96s) = 95%
Equiprobable random Proportional random, nested Unequalabundances Speciesturnover Proportionalsegregated Equiprobablysegregated Compartmented Equiprobablyaggregated Nested Ninetypes of theoreticalmatrices to mimicobservedpatterns. Whatpattern do we expect under intensecompetition.
Whichmatrixtypeisexpected under severecompetition? 1800 matriceswithdifferentstructure, fill and size. Twometrics to identifyspeciessegregation and speciesclumping (aggregation). Competitionshouldresultin a lowdegree of aggregation and a higherdegree of segregation.
Equiprobable random Proportionalsegregated Equiprobablysegregated • Thenullexpectation of matrixpattern under intensecompetitionare • A random matrixor • A segregatedmatrixwithpronounceddifferencesinspeciesabundances. Randomnessmight be theoutcome of strongnegativespeciesinteractions.
A meta analysisof 471 empiricalpresence – absencematrices. 34 matrices (7%) hadnegativeclumpingZ-scores and significantlypositivesegregationZ-scores. 94 matrices (20%) hadnegativeclumping and positivesegregationZ-scores. In 273 matricesthesegregationmetric was higherthantheaggregationmetric (58%). Thereis no prevalence of segregation (negativespeciesinteractions). Theseresults do not corroboratetheassemblyrule model.
346 matriceswerenested. Only 3 empiricalmatricesweremorenestedthanexpectedfrompassivesampling. Only 73 empiricalmatriceshadsignificantturnover. Nested Anti-Nested
Areinteractionmatricesdifferent? FromBastola et al. 2009 FW: foodwebs, P: pollinationwebs, SD: seeddispersers. Opendots: not significantatthe 5% errorlevel Significantlynested networks Observeddegrees of nestedness inempiricalmutualistic networks increasebiodiversity and minimizesthedegree of competition. Not significantlynested networks FromBascompte et al. 2003
Nestedness and specialization Part of generalistspecies Generalists Specialists Generalists Specialists Part of specialistspecies Generalistspeciesinteractmainlywithothergeneralists. Specialistsinteracteitherwithgeneralistsorwithspecialists.